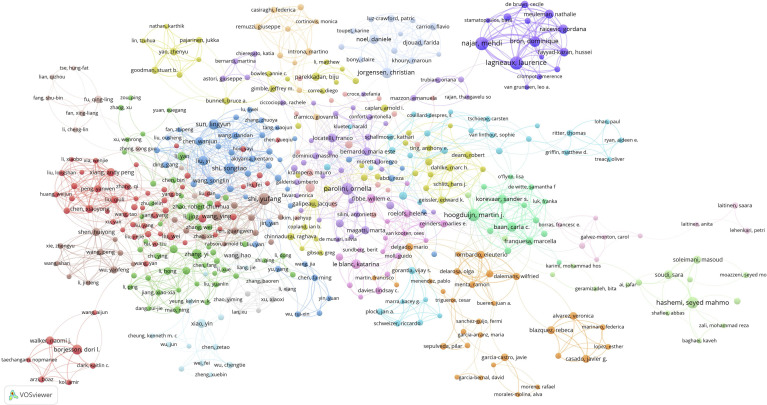
Figure 5.
Mapping author co-authorship on MSC immunomodulation publications. The size of the points represents the co-authorship frequency of authors. The line between the two points represents established collaboration between the two authors. The thickening of the line represents the collaboration degree between the two authors.

