
Fig. 5. H-Vmp1 KO mice develop NASH.
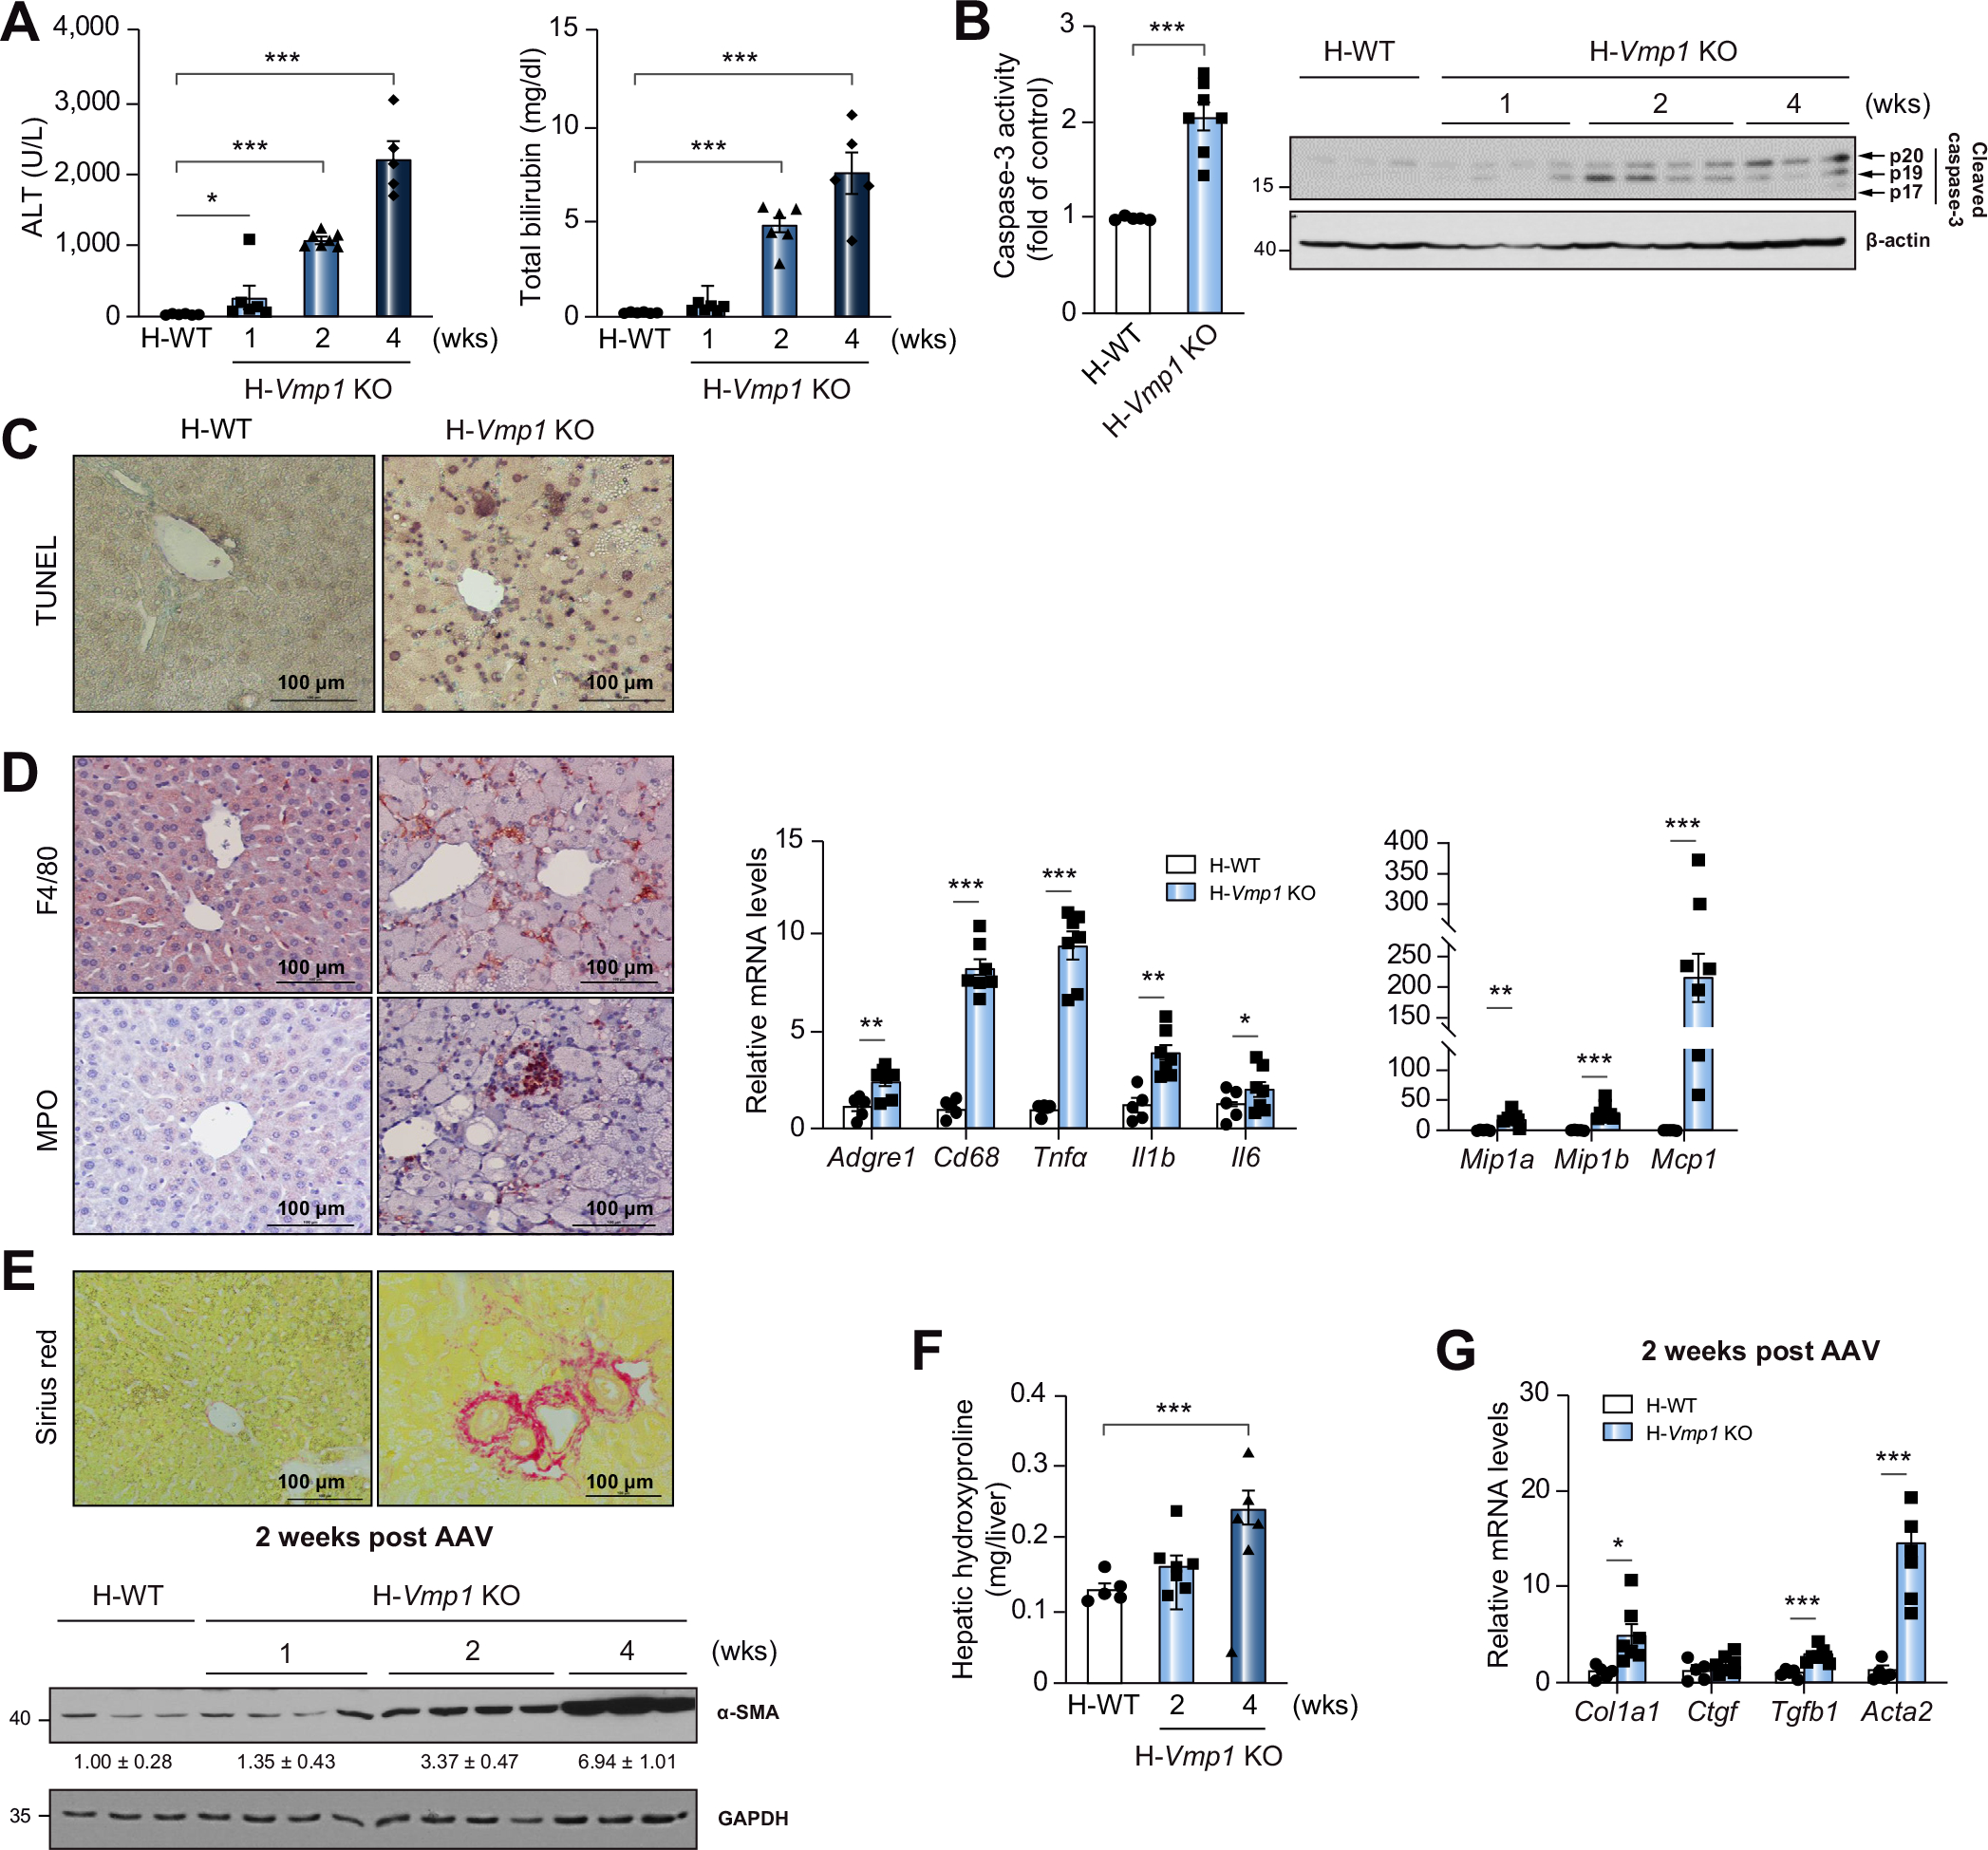
(A) Serum ALT and bilirubin of H-WT and H-Vmp1 KO mice were measured. (B) Caspase-3 activity and cleaved caspase-3 were analyzed using total liver lysates. (C) TUNEL staining and (D) immunohistochemistry staining for F4/80 and MPO in mouse livers as well as qPCR analysis of hepatic inflammatory genes. (E) Sirius red staining and immunoblot analysis of α-SMA in mouse livers. (F) Hepatic hydroxyproline and (G) qPCR analysis of fibrotic gene expression was quantified. Data represent mean ± SEM (n = 5–7). *p <0.05; **p <0.01; ***p <0.001 (Unpaired Student’s t test for 2 group comparison or one-way ANOVA with Holm-Sidak post hoc test for multigroup comparison). ALT, alanine aminotransferase.