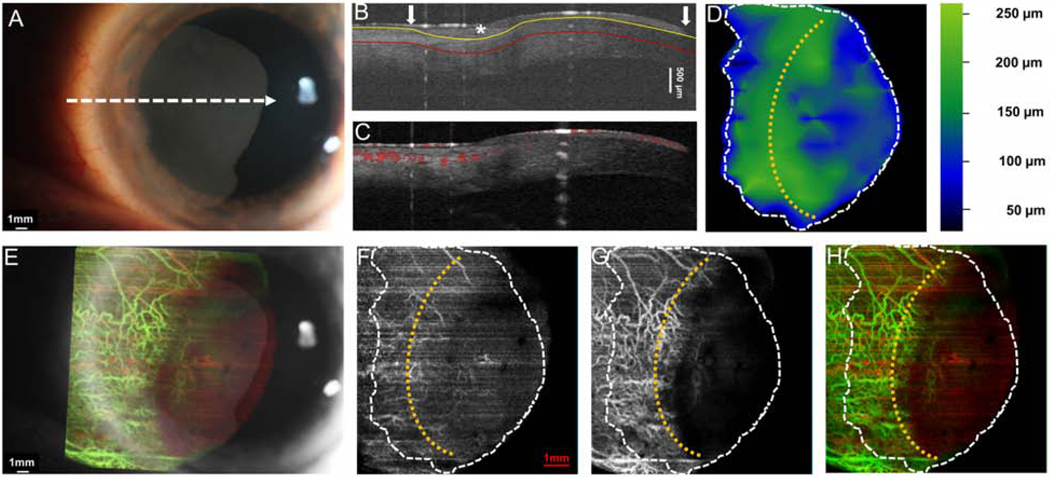
Figure 5. A 56-year-old male with a primarily corneal OSSN with adjacent gelatinous lesion involving the limbus and cornea.
(A) Slit-lamp photograph depicts a primarily opalescent corneal OSSN with limbal conjunctival involvement. No blood vessels were visible under the slit lamp in the corneal portion of the OSSN. White dashed arrow shows the cross-sectional cut. (B) The cross-sectional image reveals mildly thickened hyper-reflective epithelium on the cornea and conjunctiva (asterisk) with an abrupt transition from normal to abnormal (arrow). The yellow line shows the bottom boundary of OSSN. The red line shows the sub-epithelial tissue (200 μm) underneath the tumor. (C) Cross-sectional OCT detects the blood flow signals in the epithelium of both the corneal and conjunctival OSSN and the sub-epithelial tissue under limbal portion of the OSSN. (D) The tumor thickness map depicts the thickness of the tumor, demonstrating that it is thickest at the limbus. (E) Overlay of the enface angiograph with grayscale slit-lamp illustrates the vessels on the ocular surface in relation to the slit-lamp view. (F) The enface angiograph of OSSN and epithelium adjacent to OSSN shows scattered vasculature in the conjunctival and corneal portion of the OSSN. (G) Interestingly, there were tufts of abnormal blood vessels under the corneal component, which could not be visualized with the slit lamp. (H) The merged image from the angiographic enface images (F and G) shows the vessels within the tumor OSSN (red) connecting to the vessels under the tumor in the sub-epithelial tissue (green).
OSSN, ocular surface squamous neoplasia. Dashed white lines (D, F, G, and H) indicate the tumor boundary. Curve dashed yellow line (D, F, G, and H) indicates the limbus.

