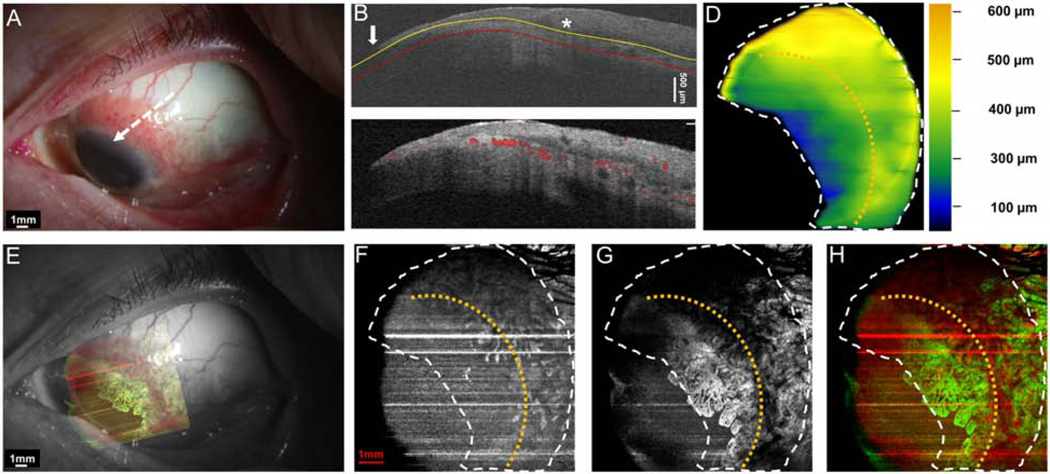
Figure 8. A 71-year-old male patient with a papillomatous OSSN involving limbus and cornea.
(A) Slit-lamp photograph of a papillomatous OSSN on the conjunctiva and cornea. White dashed arrow shows the cross-sectional cut. (B) The cross-sectional image reveals significantly thickened epithelium on the conjunctiva (asterisk) with an abrupt transition from normal to abnormal (arrow). The yellow line shows the bottom boundary of OSSN. The red line shows the sub-epithelial tissue (200 μm) beneath the tumor. (C) Cross-sectional OCT detects the blood flow signals in the epithelium of both the corneal and conjunctival OSSN, and the sub-epithelial tissue of the OSSN. (D) The tumor thickness map depicts the thickness of the tumor, demonstrating that it is thickest at the bulbar conjunctival margin. (E) Overlay of the enface angiograph with grayscale slit-lamp in relation to the slit-lamp view. The corneal vasculature is easily visualized. (F)The enface angiograph of OSSN illustrates the vessels are primarily within the conjunctival portion of the OSSN. (G) The enface angiograph of the sub-epithelial space, 200 μm below the tumor demonstrates dramatic vessel “sea fan” under the corneal component, which was not well seen under the slit lamp. (H) The merged image from the angiographic enface images (F and G, show the vessels within the tumor OSSN (red) and under the tumor in the sub-epithelial tissue (green). (H) The merged image from the angiographic enface images (F and G) shows the vessels within the tumor OSSN (red) and under the tumor in the sub-epithelial tissue (green) demonstrating that the majority of the vessels are deep in the sub-epithelial space.
OSSN, ocular surface squamous neoplasia. Dashed white lines (D, F, G, and H) indicate the tumor boundary. Curve dashed yellow line (D, F, G, and H) indicates the limbus.

