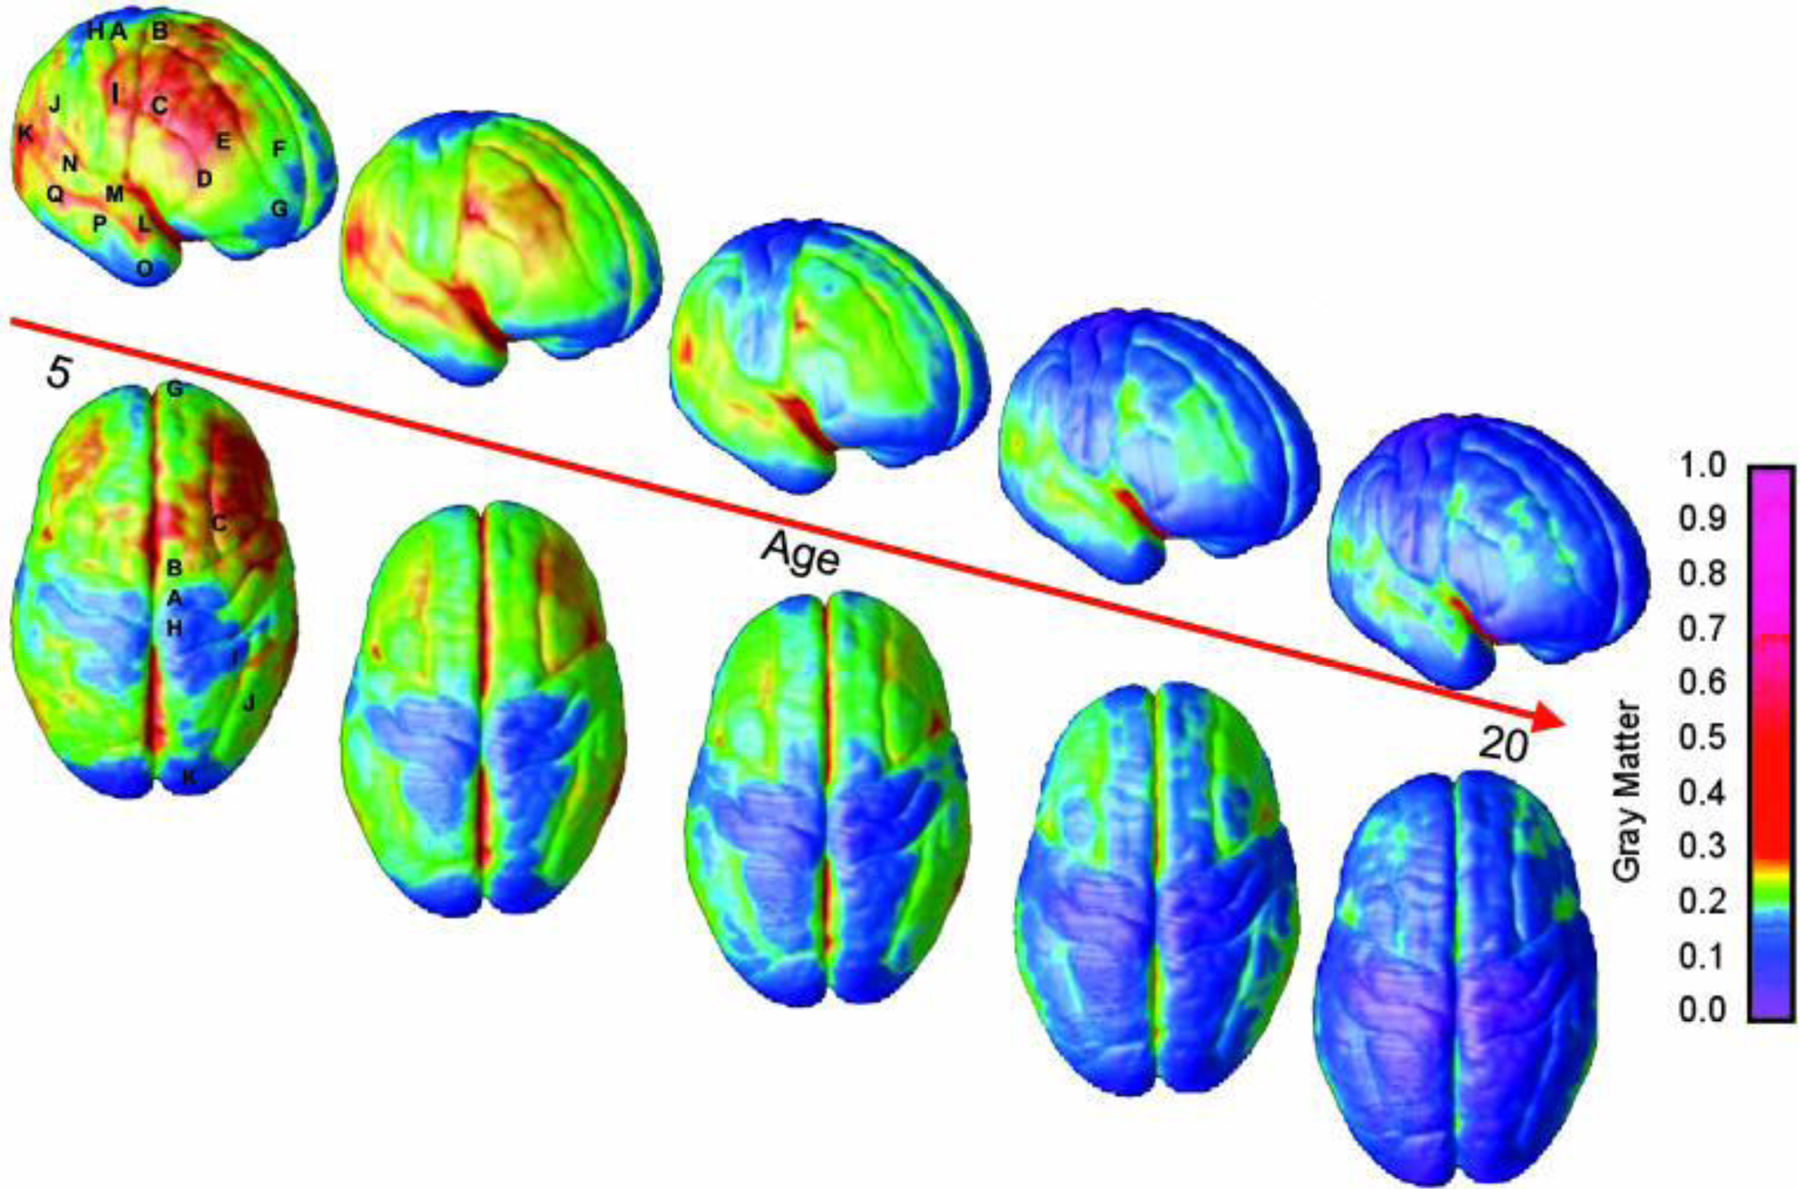
Figure 1:

Right lateral and top views of the dynamic sequence of gray matter maturation over the cortical surface. The side bar shows a color representation in units of gray matter volume. The following regions were selected for analyses in each hemisphere: A, precentral gyrus and primary motor cortex; B, superior frontal gyrus, posterior end near central sulcus; C, inferior frontal gyrus, posterior end; D, inferior frontal sulcus, anterior end in the ventrolateral prefrontal cortex; E, inferior frontal sulcus in the dorsolateral prefrontal cortex; F, anterior limit of superior frontal sulcus; G, frontal pole; H, primary sensory cortex in postcentral gyrus; I, supramarginal gyrus (area 40); J, angular gyrus (area 39); K, occipital pole; L–N, anterior, middle, and posterior portions of STG; O–Q, anterior, middle, and posterior points along the inferior temporal gyrus anterior end.
(Reproduced from Gogtay N, Giedd JN, Lusk L, et al. Dynamic mapping of human cortical development during childhood through early adulthood. PNAS. 2004;101(21):8174–8179.)
