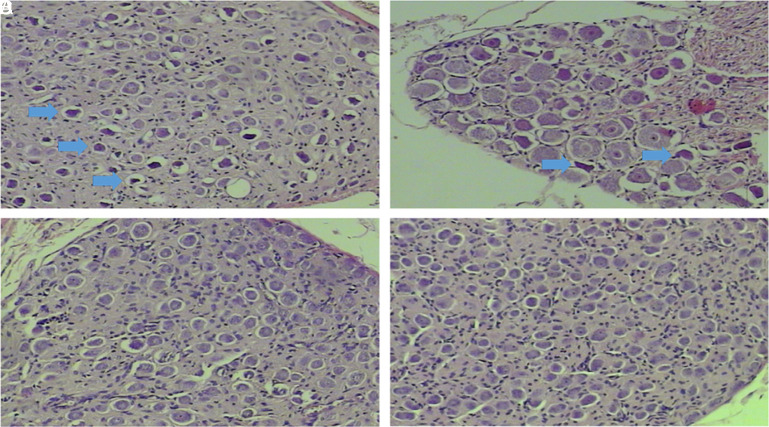
Figure 3. a-d.
H&E staining of spiral ganglion cross-section of all groups. (a) Experimental NS group 100×, (b) experimental OLE group 200×, (c) Control NS group 100×, (d) Control OLE group 100×. Prominent picnotic cells (blue thick arrows) in the experimental OLE group (b) are lesser than the experimental NS group (a), while no picnosis was observed in the control NS and OLE group (c and d). H&E, hematoxylin–eosin; OLE, oleuropein; NS, normal saline.

 Content of this journal is licensed under a