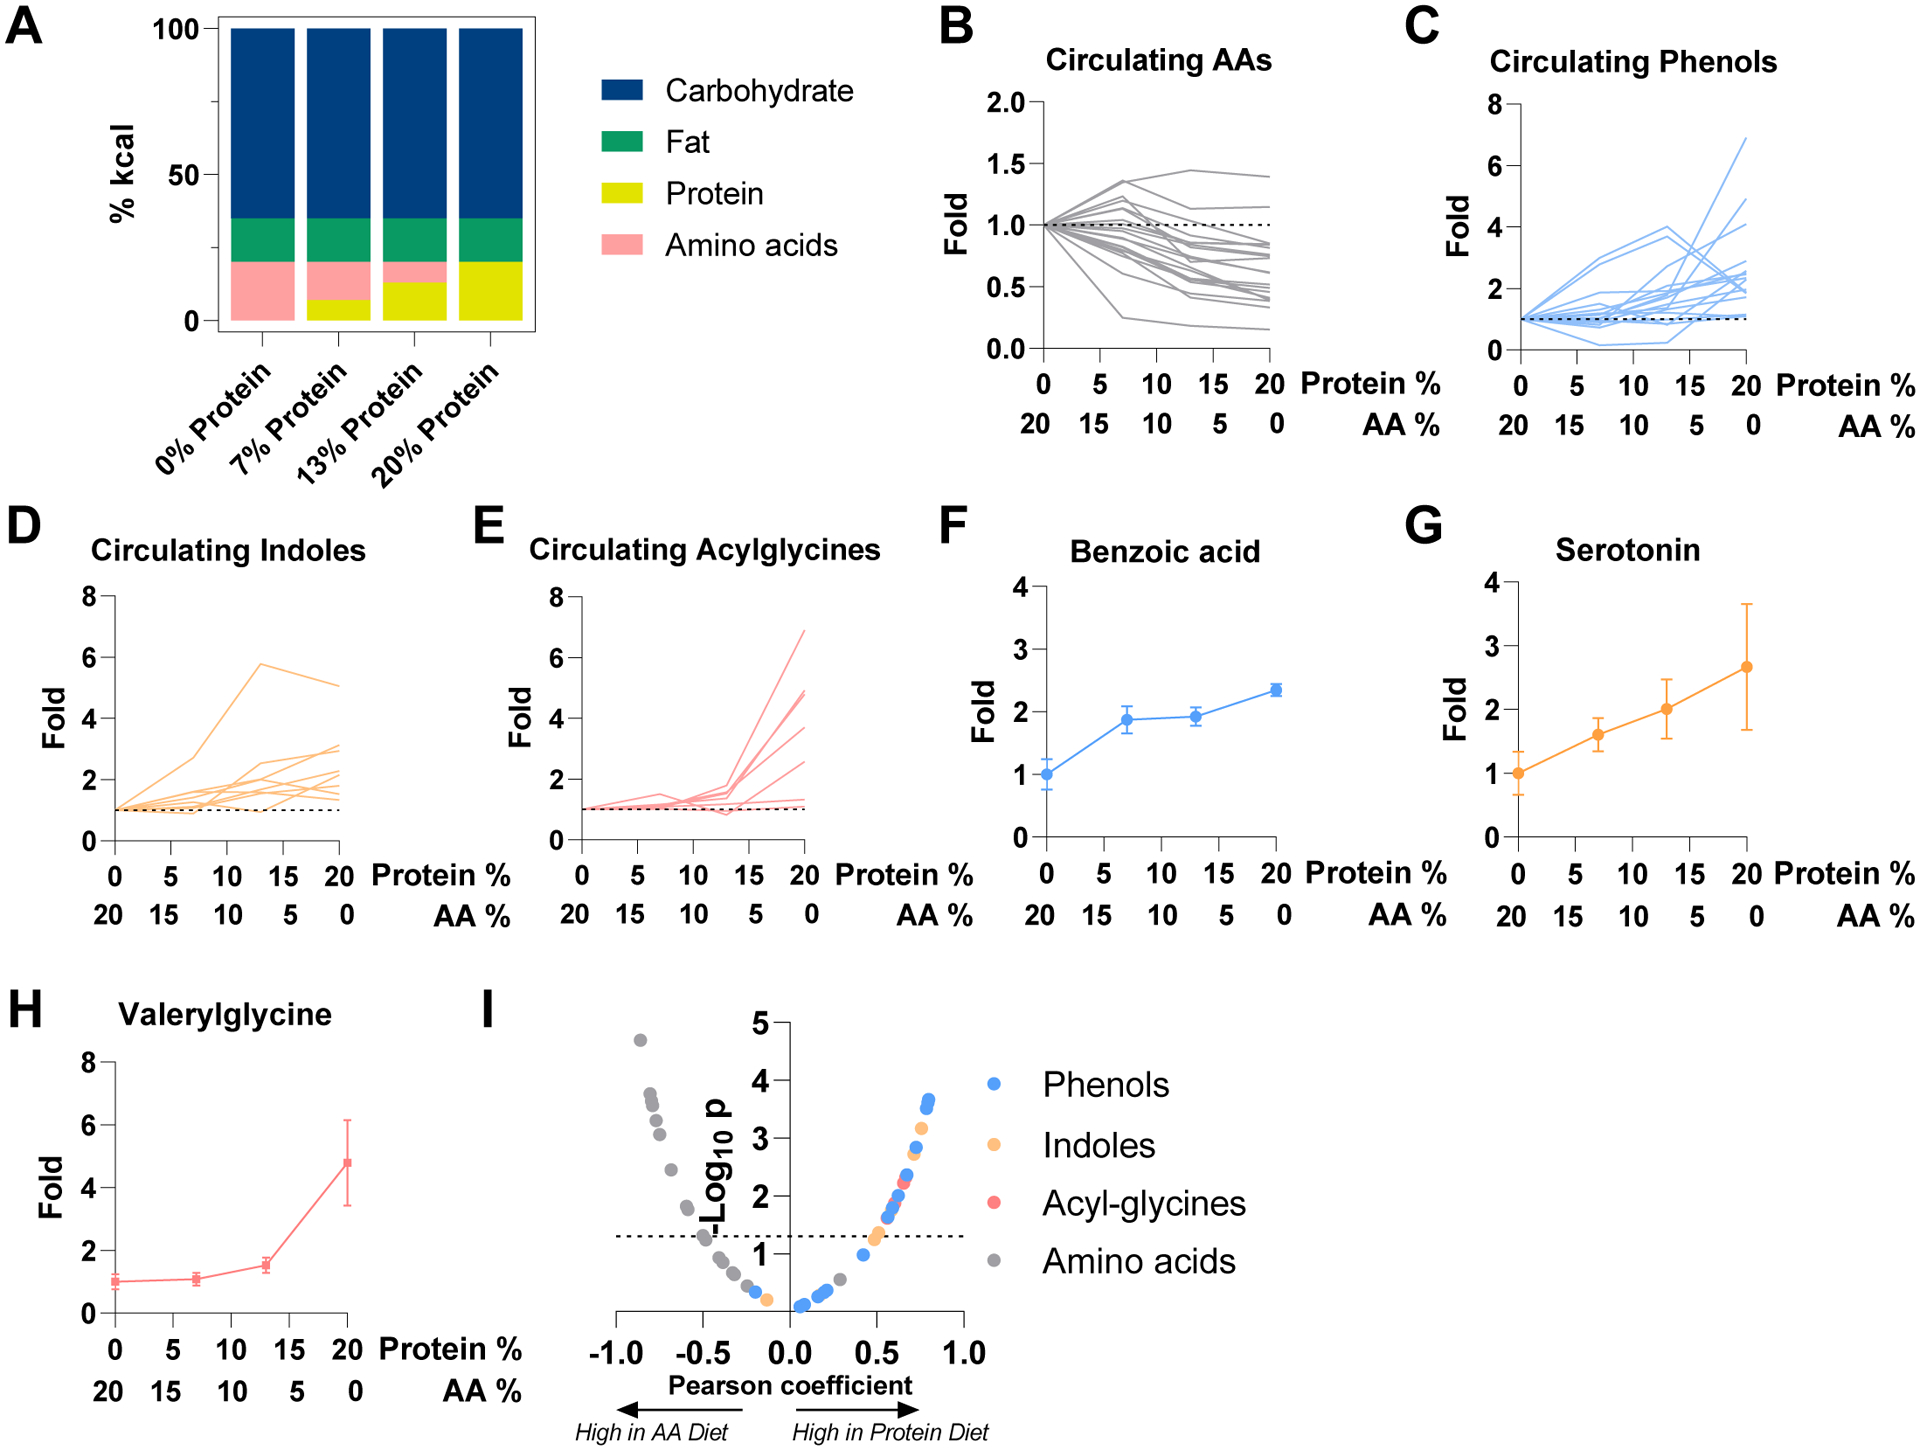
Figure 3. Circulating levels of microbiota metabolites depend on protein reaching the microbiome.

(A) Compositions of diets used in the figure. “Protein” is casein. “Amino acids” are composition-matched free amino acids.
(B) Concentration of circulating amino acids in systemic circulation after two weeks test diet relative to free amino acids diet. Serum was taken at ad lib fed state. Each metabolite is a line. Mean, N = 4 mice.
(C) As in (B), for phenols. Mean, N = 4 mice.
(D) As in (B), for indoles. Mean, N = 4 mice.
(E) As in (B), for acylglycines. Mean, N = 4 mice.
(F) As in (B) for benzoic acid. Mean ± s.e., N = 4 mice.
(G) As in (F), for serotonin. Mean ± s.e., N = 4 mice.
(H) As in (F), for valerylglycine. Mean ± s.e., N = 4 mice.
(I) Correlation between dietary protein (as opposed to free amino acid) fraction in diet and metabolite abundances (relative to amino acid diet). The volcano plot shows Pearson coefficient and P value of correlation between metabolite levels to casein abundance in diet.
