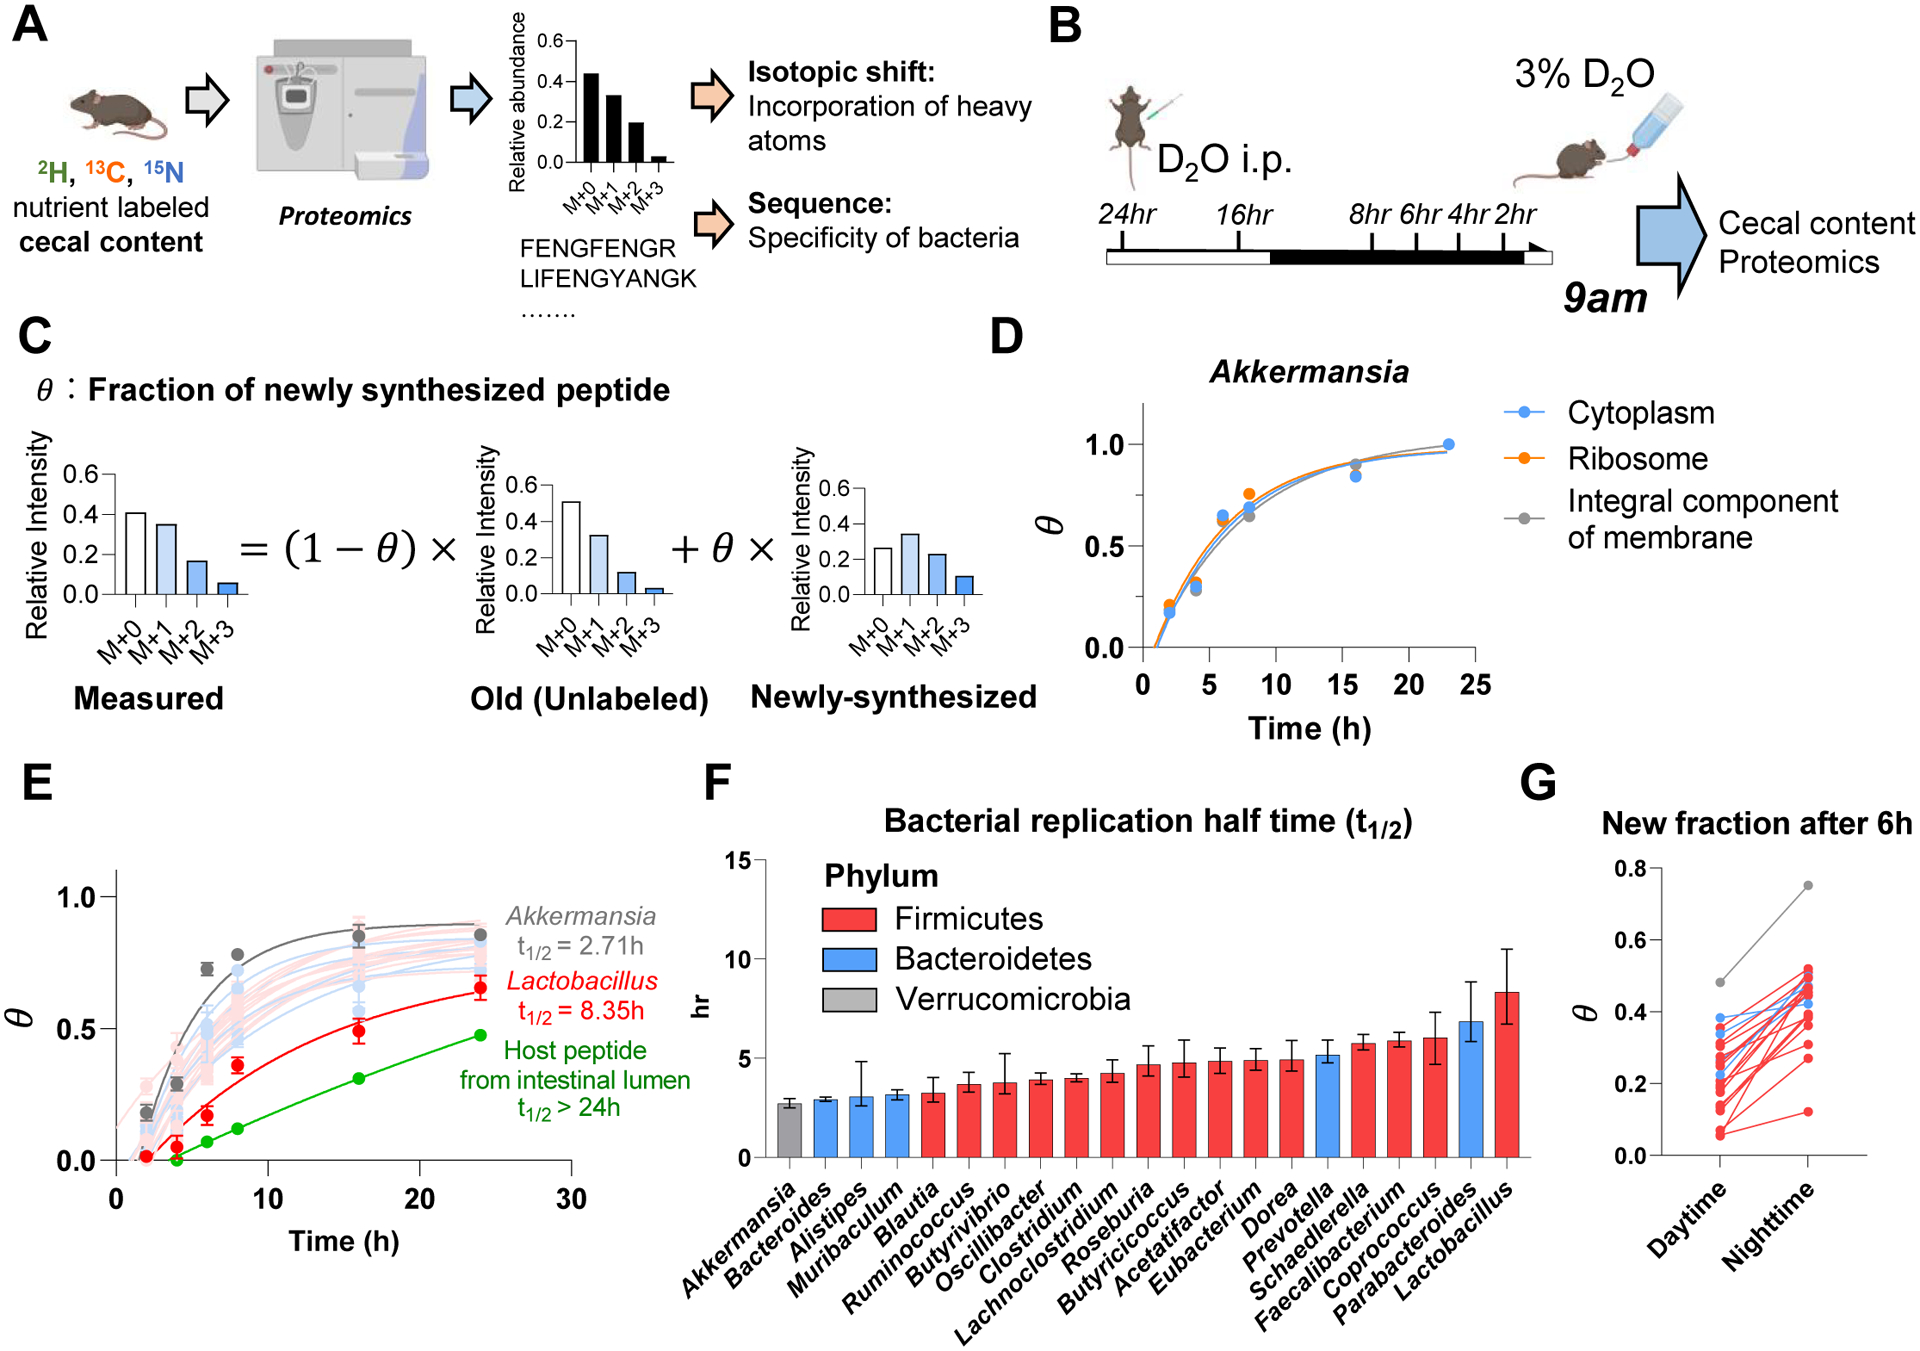
Figure 4. Growth rate of different gut bacterial genera quantified by isotope tracing. See alsoFigure S5.

(A) Experimental approach for isotope tracing into specific gut bacteria. Only peptides that are specific to a particular bacterial genus were examined.
(B) Growth rate quantification using D2O. Mice received D2O by i.p. injection followed by D2O drinking water and cecal content labeling was measured over time by proteomics and metabolomics. Mice were fed ad lib; tissues were harvested at 9am.
(C) Calculation of newly synthesized peptide fraction (θ). The experimentally observed peptide mass isotope distribution was fit to a linear combination of unlabeled peptide (“old,” heavy forms from natural isotope abundance) and newly synthesized peptide (“new,” heavy forms from isotope labeling pattern of free cecal amino acids and from natural isotope abundance).
(D) Different cellular compartments from the same bacterial genus show similar labeling rate. Mean, N = 5 mice for each time point.
(E) Genus-specific growth rates were determined by a single exponential fitting, as a function of time, of θ (mean across both different peptides measured from that genus and replicate mice). Mean±s.e., N = 5 mice for each time point.
(F) Bacterial replication half time of different gut bacteria. Data are exponential fits ±s.e.
(G) The gut bacteria synthesize protein in sync with the physiological feeding patterns of the host. The figure shows the average newly synthesized peptide fraction (θ) for different gut bacterial genera after D2O labeling during daytime vs nighttime. Each line connects the daytime and nighttime measurements for one genus. Mean, N = 5 mice for daytime and for nighttime.
