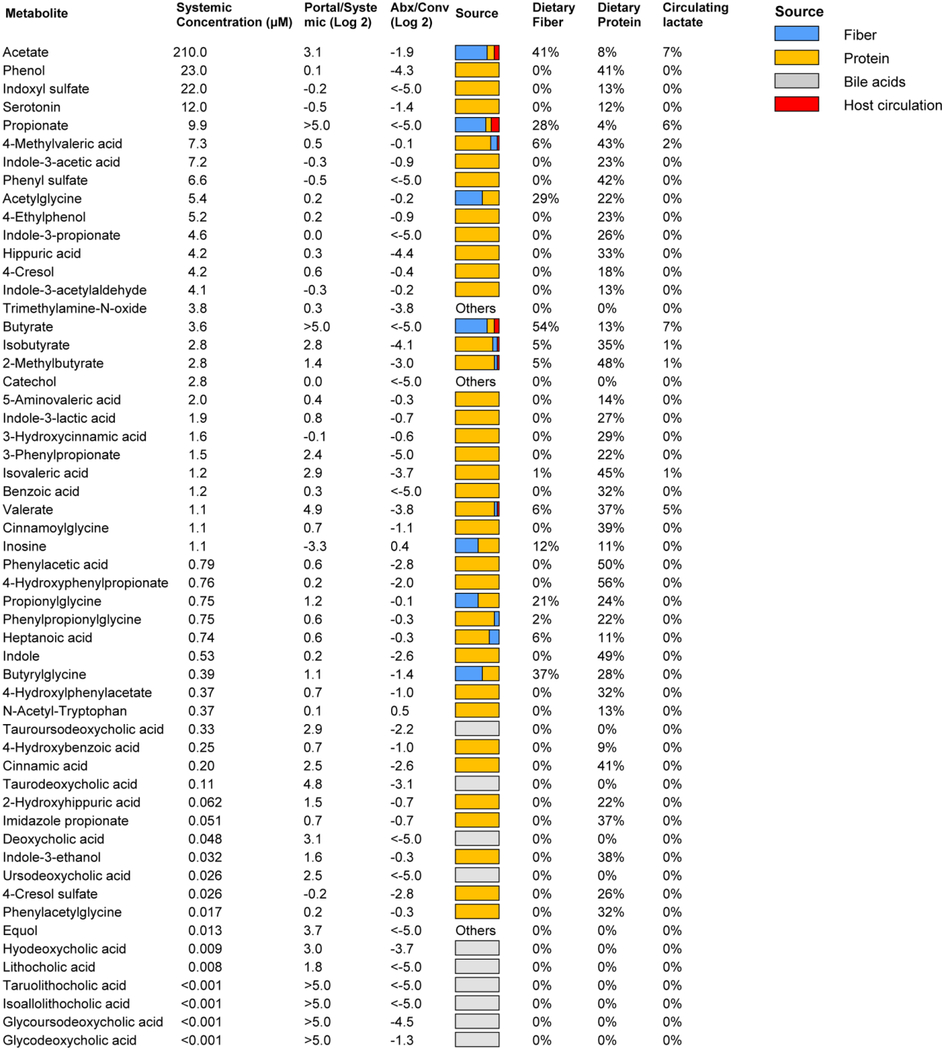
Table 1. Absolute concentrations and sources of microbiota-associated metabolites. See alsoTable S1,Figure S1,S4.
Data are from ad lib fed state (ZT0); for ad lib fasted state (ZT12), see Supplementary Table S1. Absolute concentration is mean, N = 5 mice. Portal/systemic = fold-change in concentration between the portal vein and tail vein (median, N = 5 mice). Abx/Conv refers to fold-change in portal blood concentration between mice treated with antibiotics cocktail versus not (median, N = 5 mice/group). Source bar indicates the relative contribution to the indicated metabolite from dietary inulin, algal protein and circulating lactate (based on isotope tracing). Percentages indicate quantitative relative contributions from those nutrients (median, N = 4). Numbers typically add up to less than 100%, as other sources (e.g., mucins) contribute.

|
