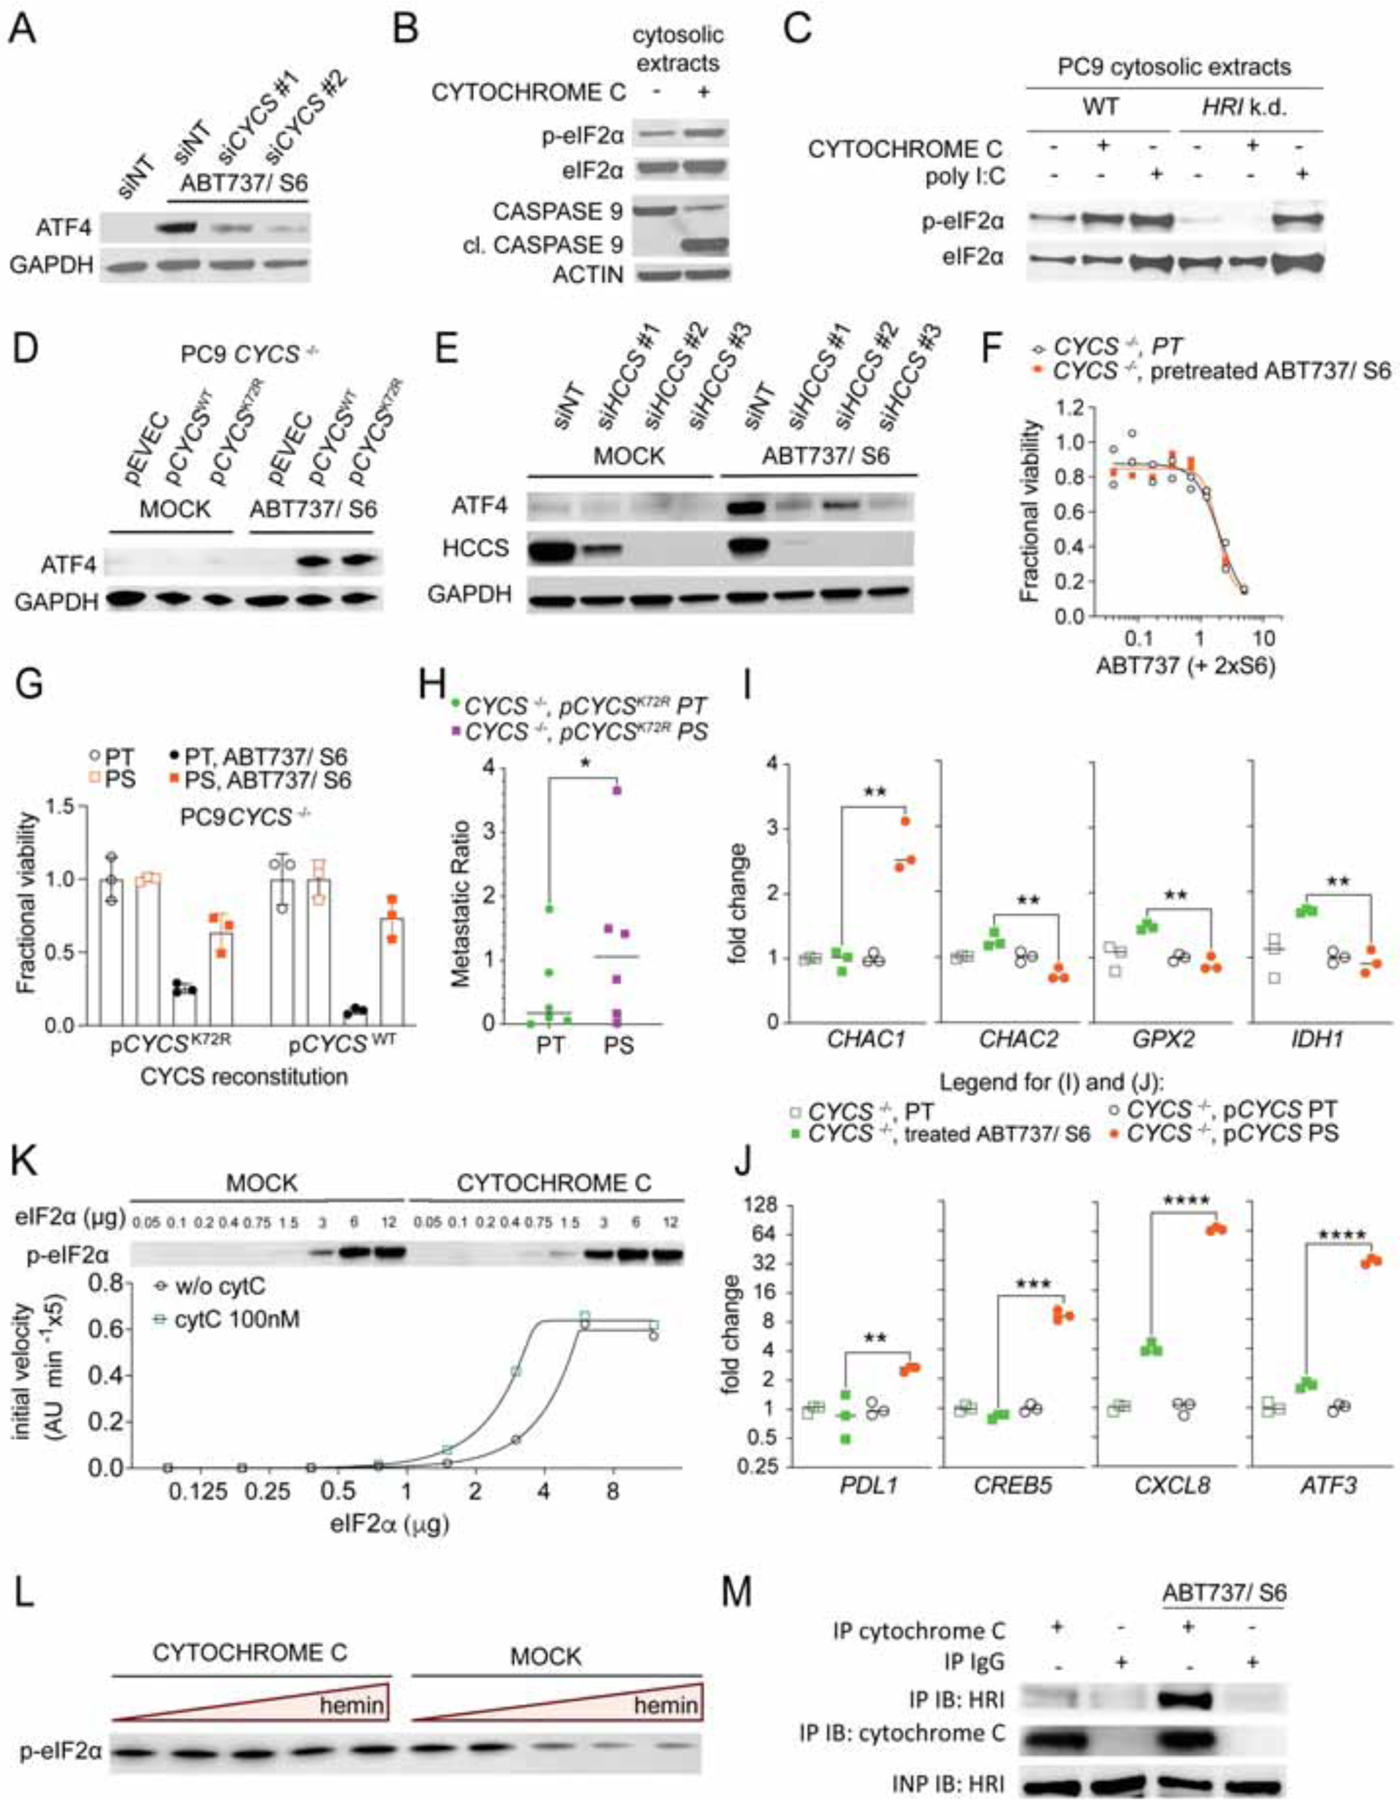
Figure 6. Cytochrome c activates HRI and engages the persister phenotype.

(A) Immunoblot with the indicated antibodies of PC9 cells that had been transfected with non-targeting (siNT) or 2 different CYCS targeting siRNAs, and treated ± ABT737 1.5μM and S6 3μM for 4h. All samples were treated with Q-VD-OPh 20μM.
(B) Immunoblot of cytosolic extracts from PC9 cells treated ± 100nM bovine Cytochrome c for 30min in the presence of 50μM ATP.
(C) Immunoblot of cytosolic extracts from PC9 WT and HRI-silenced cells treated ± 100nM bovine Cytochrome c or 10μg/ml poly I:C for 30 min in the presence of 50μM ATP.
(D) Immunoblot with the indicated antibodies of PC9 CYCS −/− cells, reconstituted ± WT or K72R mutant CYCS and treated ± ABT737 1.5μM and S6 3μM for 4h. All samples were treated with Q-VD-OPh 20μM.
(E) Immunoblot with the indicated antibodies of PC9 cells that had been transfected with non-targeting (siNT) or different HCCS-targeting siRNAs and treated ± ABT737 1.5μM and S6 3μM for 4h. All samples were treated with Q-VD-Oph 20μM.
(F) Fractional viability of PT and BH3-mimetic survivors generated from PC9 CYCS−/− cells treated with a titration of ABT737 and S6. Mean ± s.d. of 3 samples. One representative of n=2 independent experiments shown.
(G) Fractional viability of PT and PS generated from PC9 CYCS−/− cells, reconstituted ± WT or K72R mutant CYCS and treated ± ABT737 1.5μM and S6 3μM. One representative of n=2 independent experiments shown.
(H) Metastatic ratio of PT and PS generated from PC9 CYCS−/− cells that had been reconstituted with CYCS K72R mutant (n=6 mice/group). Statistical analysis by paired student’s t-test. *P <0.05.
(I) and (J) qPCR analysis of transcripts involved in glutathione metabolism (I) or diverse transcripts that have been identified as BCL2 effector protein dependent (J) of PT and PS generated from PC9 CYCS−/− cells, reconstituted ± WT CYCS. N=3 samples are shown. Statistical analysis was performed using unpaired student’s t-test. **P <0.01, ***P <0.001; ****P <0.0001.
(K) Immunoblot and HRI enzyme kinetics in the presence or absence of Cytochrome c 100nm with recombinant proteins. One representative fitting curve from n=3 independent experiments shown.
(L) Immunoblot of in vitro kinase reaction with recombinant eIF2α and HRI, in the presence or absence of Cytochrome c and ± hemin titration (from 2μM max. to 3nM min., 1:5 dilutions in kinase buffer).
(M) Immunoprecipitation of endogenous Cytochrome c or IgG (negative control) from APAF1 KO PC9 cells treated ± ABT737 and S6.
See also Figures S4 and S5.
