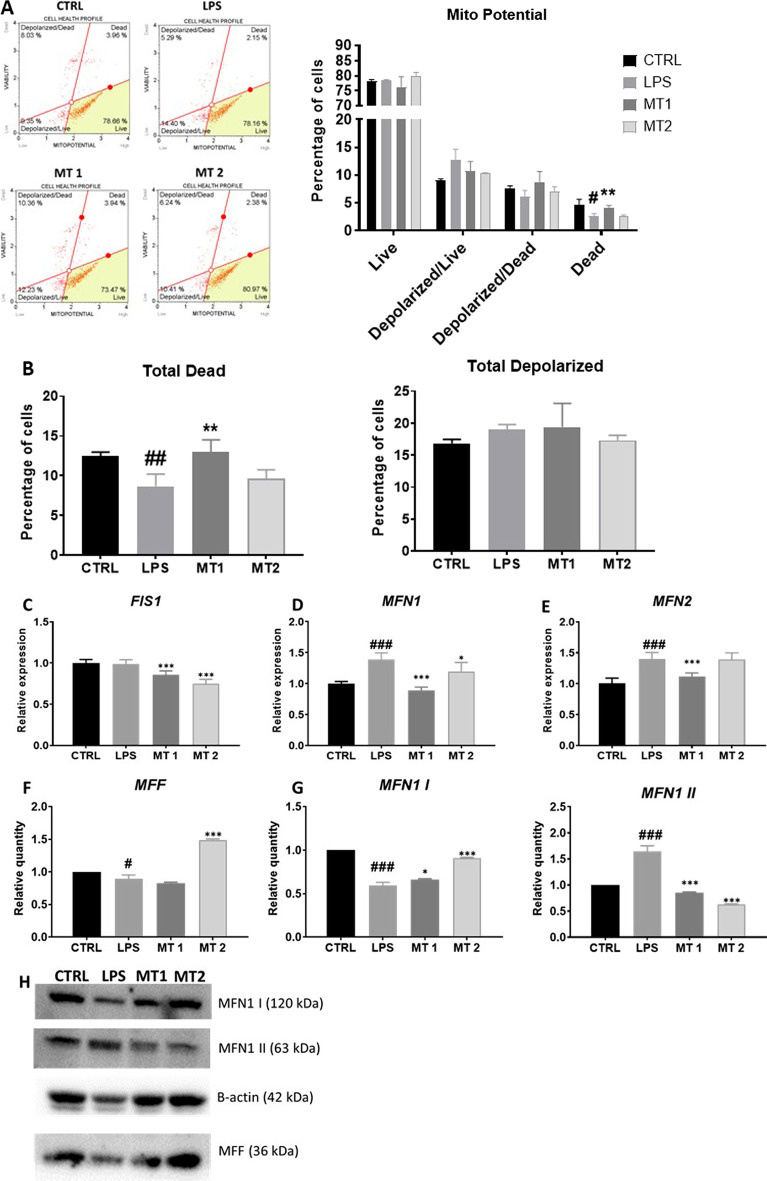
Fig. 7.
Regulation of mitochondrial metabolism and dynamics. Oxidative stress was analyzed with Muse Mitopotential kit (A). Based on the obtained results total dead cells (B) number was calculated. Relative expression of genes related to mitochondrial dynamics FIS1 (C), MFN1 (D), MFN2 (E) was established with RT-qPCR. The level of mitochondrial proteins MFF (F) and MFN1 (G) was investigated with western blot (H). Additionally, expression of mitophagy PINK1 (I), PARKIN (J) and mitochondrial biogenesis PGC1A (K) genes was analysed with RT-qPCR. Results expressed as mean ± SD. Statistical significance indicated as asterisk (*) when comparing the result to LPS and as number sign (#) when comparing to CTRL. *,#p < 0.05, **,##p < 0.01, ***,###p < 0.001


