Fig. 7.
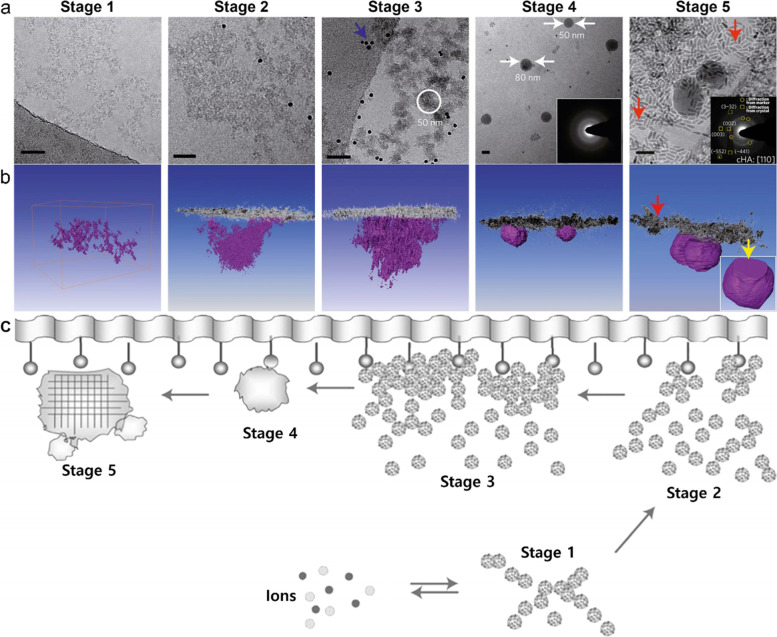
Mineralization stages. a Two-dimensional projection images and (b) three-dimensional visualizations of tomograms. Stage 1 is in the absence of a monolayer, and stages 2–4 are that the inset SAED pattern in (a) shows that the spherical particles on the monolayer are amorphous phases. Finally, stage 5 is that the inset SAED pattern in (a) can be indexed as cHAp with a [110] zone axis. The yellow arrow in (b) indicates the preferred nucleation plane (110). The red arrows indicate the markers, and the blue shows the Au beads. Scale bars, 50 nm. c Surface-directed mineralization stages of CaP from SBF at 37 °C. Stage 1 represents the loose aggregation of the prenucleation cluster in equilibrium with the ions of the solution, and stage 2 shows that the nucleated cluster aggregates in the presence of a monolayer so that the loose aggregate still exists in the solution. Stages 3 and 4 show cohesion leading to densification near the monolayer, indicating the nucleation of amorphous spherical particles only on the monolayer surface, and the last 5 stage shows the development of crystallinity due to oriented nucleation directed by the monolayer [95], Copyright © 2010, Nature Publishing Group

