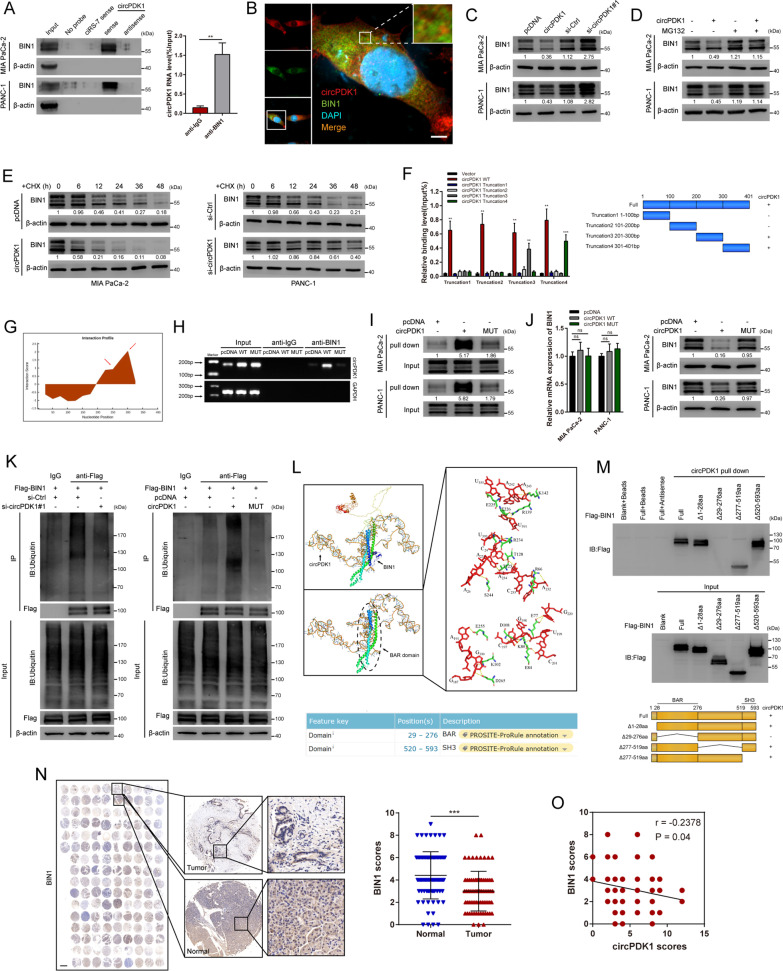
Fig. 6.
circPDK1 interacts with BIN1 and enhances BIN1 ubiquitination. A RNA pull-down verified the interaction of circPDK1 with BIN1. β-actin was used as a negative control. RIP assay was used to determine the relative expression of circPDK1 with rabbit BIN1 and IgG antibodies in MIA PaCa-2 cells. B Co-localization of circPDK1 (RED) with BIN1 proteins (GREEN), respectively, in MIA PaCa cells. Scale bar = 5 μm. C The expression of BIN1 in protein level after circPDK1 overexpression or loss of circPDK1. D The BIN1 protein level in MIA PaCa-2 and PANC-1 cells with circPDK1 overexpression treated with MG132 (20 μM) for 12 h. E The BIN1 protein level in indicated time point after treated with cycloheximide (CHX, 10 µg/mL) in transfected PC cells. F The interaction of circPDK1 truncations with BIN1 was confirmed by RIP assay in 293 T cells (left) and schematic diagram of circPDK1 full-length and truncations (right). G Interaction profile between circPDK1 and BIN1 was predicted by catRAPID. H RIP assays were performed using anti-BIN1 antibodies in MIA PaCa-2 cells by RT-PCR. I RNA pull-down assay was used to determine the interaction between circPDK1-WT or circPDK1-MUT and BIN1. J BIN1 mRNA and protein level were detected after transfected with circPDK1-WT or circPDK1-MUT. K IP assays verified the ubiquitination modification level of BIN1 in MIA PaCa-2 cells with indicated treatments. L The specific binding sites between circPDK1 and BIN1 was accurately construct by Atomic Rotationally Equivariant Scorer (ARES) (top) and the protein domain of BIN1 queried from UniProt (bottom). M RNA pull-down assays was performed to verify the interaction between truncated BIN1 protein and circPDK1 (top) and schematic of truncated BIN1 protein (bottom). N The expression of BIN1 in PC tumor tissues and matched normal tissues verified by IHC assays in tissue microarrays. Scale bar = 1000 μm. O The correction of circPDK1 and BIN1 protein level was verified by IHC assays in tissue microarrays. *P < 0.05; **P < 0.01; ***P < 0.001; ns, no significance

