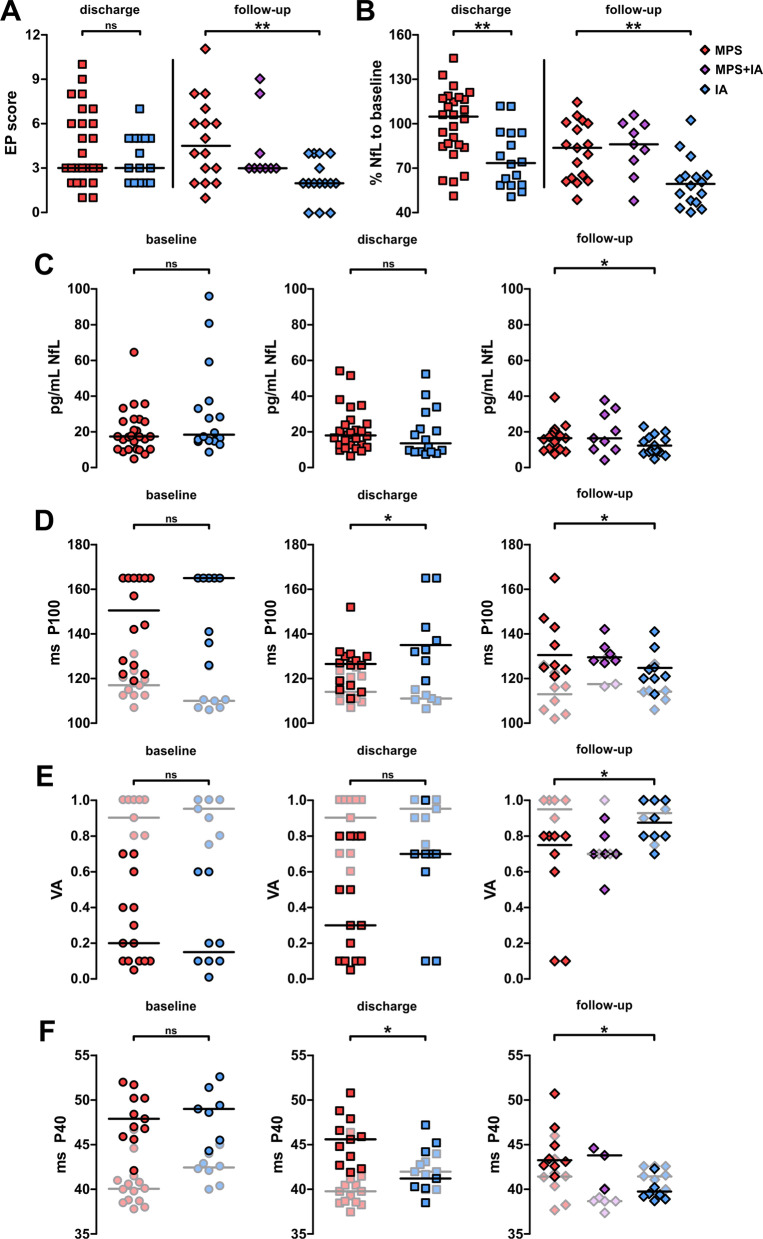
Fig. 2.
Determination of NfL serum levels, visual acuity and evoked potentials. A Difference of evoked potential scores at discharge (boxes; applies throughout) and follow-up (diamonds; applies throughout) compared to baseline. B Relative serum neurofilament light-chain levels at discharge and follow-up compared to baseline. C: Absolute levels of serum neurofilament light-chain levels at baseline (circles; applies throughout), discharge and follow-up. D Absolute values for visual-evoked potential P100 latencies among groups (affected eyes in ON patients). 40% grey symbols indicate patients with relapses other than optic neuritis (average of both eyes; applies to E as well). Conduction block was assumed at P100 > 165 ms. E Visual acuity of patients during the study (affected eyes in ON patients). F Absolute values for somatosensory-evoked tibial P40 latencies (body length was equally distributed among groups; p = 0.285). 40% grey symbols indicate patients with optic neuritis. Lines indicate median throughout. *: p < 0.05; ns: p > 0.05; significance levels were determined using Mann–Whitney rank sum test (baseline, discharge) or Kruskal–Wallis test (follow-up). IA immunoadsorption, MPS methylprednisolone, EP evoked potential; NfL neurofilament light-chain, P100 visual-evoked potential P100 latency, VA visual acuity, P40 somatosensory-evoked tibial P40 latency

