Chart 2D.

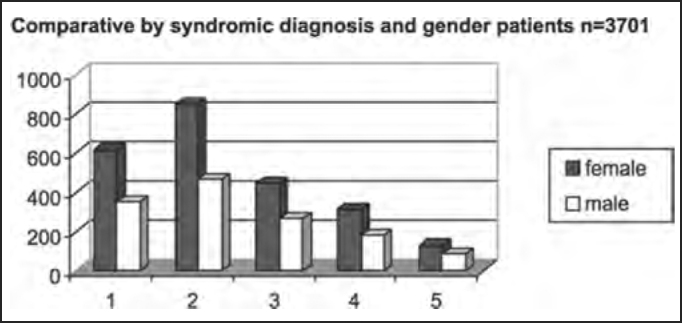
Comparative distribution by syndromic diagnosis and gender in patients submitted to complete otoneurological assessment. 1 – normal; 2 – peripheral; 3 – central; 4 – mixed; 5 – uncharacteristic.

Comparative distribution by syndromic diagnosis and gender in patients submitted to complete otoneurological assessment. 1 – normal; 2 – peripheral; 3 – central; 4 – mixed; 5 – uncharacteristic.