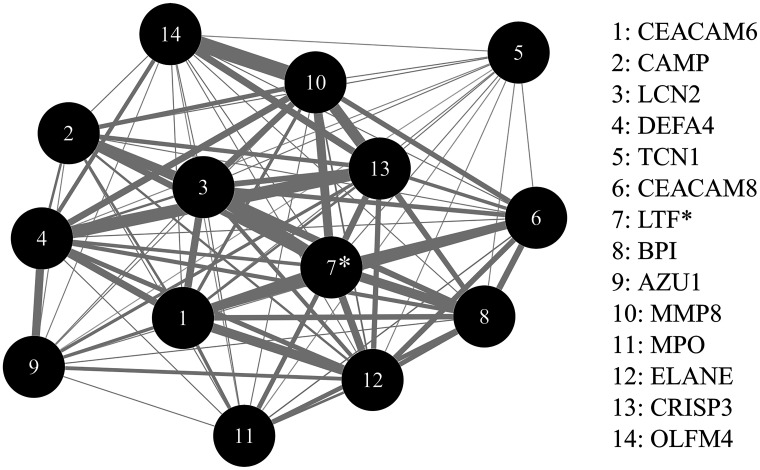
Figure 2.
LTF network module. Each node represents a gene within the LTF module. Genes are ranked (1, most significant to 14, least significant) based on P values representing the difference in change in gene expression during IA across the three groups, reverters, progressors, and maintainers. (Group * visit interaction P values for each gene are displayed in Table 4.) The edges are weighted based on the correlation between the pairs of genes. Only correlation coefficients >0.65 are weighted. *Represents the hub gene for the network.

