
Figure 2.
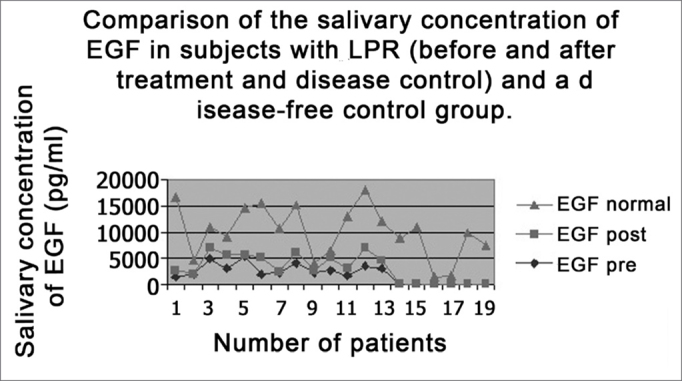
EGF salivary concentration mean values in the two study periods (pre and post treatment) with EGF salivary concentration average in a control population (without reflux).
Official websites use .gov
A
.gov website belongs to an official
government organization in the United States.
Secure .gov websites use HTTPS
A lock (
) or https:// means you've safely
connected to the .gov website. Share sensitive
information only on official, secure websites.
EGF salivary concentration mean values in the two study periods (pre and post treatment) with EGF salivary concentration average in a control population (without reflux).