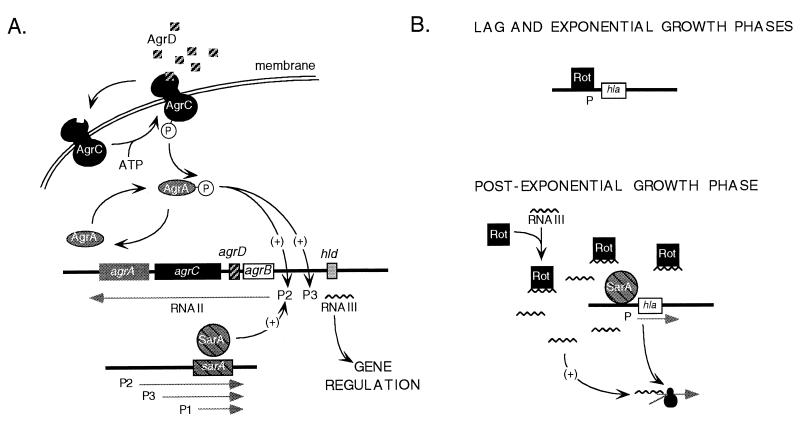
FIG. 1.
(A) Model of the function of the agr-sar system; (B) hypothetical model of the function of the rot gene product. Details can be found in the text. Chromosomal DNA is depicted as a thick black line. Promoters (P) are numbered. Genes (boxes) and their translation product are identically shaded. Phosphorylated proteins are associated with a circled letter P. The straight arrows and squiggly lines represent mRNA. Translation of hla mRNA is illustrated by the addition of a ribosome (black circles) to the message. The curved arrows show the relationships among the components of the system. Positive and negative effects are marked with (+) and (−), respectively.

