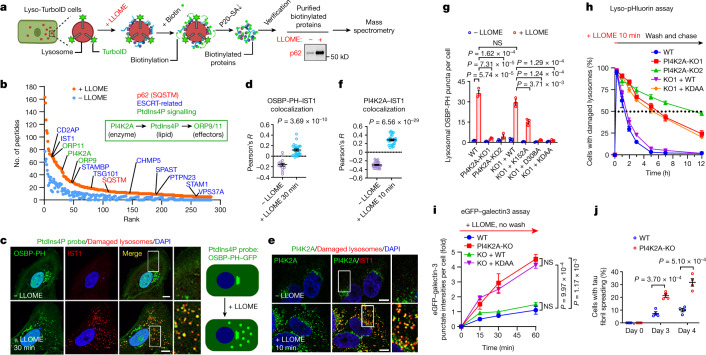
Fig. 1. An unbiased proteomic screen identifies PI4K2A-mediated PtdIns4P signalling in rapid lysosomal repair.
a, Schematic illustration of the Lyso-TurboID screen. P20-SA↓, streptavidin (SA) pulldown from P20, the pellet fraction after centrifugation at 20,000 g. b, Scatter plot of the top proteins from more than 1,800 mass spectrometry hits. Three categories of proteins are labelled in colour. ORP9/11 are known PtdIns4P effectors. c, Left, OSBP-PH–GFP is recruited to damaged lysosomes in U2OS cells; the outlined region is magnified on the right. Right, a schematic illustration of the response. d, Pearson’s correlation coefficient (R) for OSBP-PH–GFP and IST1. Data are mean ± s.e.m.; n = 15 (−LLOME), n = 27 (+LLOME) cells from 3 trials. e, Endogenous PI4K2A accumulates rapidly on damaged lysosomes in U2OS cells; the outlined region is magnified on the right. f, Pearson’s correlation coefficient for PI4K2A and IST1. Data are mean ± s.e.m.; n = 27 cells from 3 trials for each condition. g, Quantification of OSBP-PH–GFP puncta in PI4K2A-KO U2OS cells expressing the indicated PI4K2A mutants. Approximately 50–100 random cells were counted per condition. Data are mean ± s.e.m.; n = 3 per condition. See fluorescence images in Extended Data Fig. 4c. WT, wild type. h, Lyso-pHluorin quantification in U2OS cells with indicated genetic modifications expressing the indicated PI4K2A mutants. More than 100 cells were counted for each condition. Data are mean ± s.e.m.; n = 3 per condition. Dotted line indicates 50% of repair. See fluorescence images in Extended Data Fig. 4d,e. i, Quantification of galectin-3 intensity above threshold in U2OS cells with indicated genetic modifications expressing the indicated PI4K2A mutants. Between 50 and 100 random cells were quantified for each condition. Data are mean ± s.e.m.; n = 3 per condition. See fluorescence images in Extended Data Fig. 4f. j, Percentage of cells exhibiting tau spreading after tau fibril exposure. Data are mean ± s.e.m.; n = 4 per condition. See fluorescence images in Extended Data Fig. 4h. All experiments were based on stable cell lines unless otherwise indicated. Statistical significance was determined by unpaired, two-tailed t-tests. Scale bars, 10 μm.

