Figure 1.
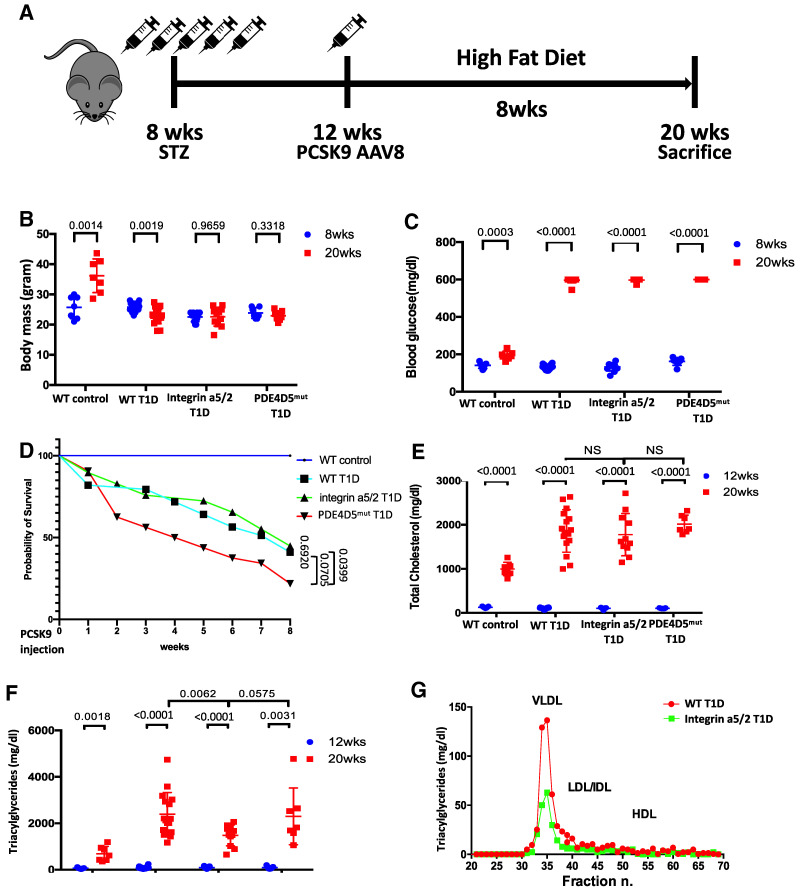
Experimental design and characterization of animals. (A) Schematic of T1D and hyperlipidemia mouse model design. (B) Body mass of animals at 8 and 20 weeks of age. (C) Blood glucose levels of animals at 8 and 20 weeks. (D) Survival curve for WT control, WT T1D, integrin α5/2-T1D, and PDE4Dmut T1D mice. Analysis was by nonlinear regression. (E) Serum cholesterol concentration at 12 and 20 weeks. (F) Serum triglyceride (TAG) level at 12 and 20 weeks. (G) Lipoprotein profile of pooled plasma of WT and integrin α5/2-T1D mice (n = 5 for each group). Student t test was used for analysis. (B–E and G) WT control, n = 7 mice; WT T1D, n = 16; integrin α5/2 T1D, n = 11; and PDE4Dmut T1D, n = 7. (B, C, E, and F) Student t test was used for comparing the same group before and after HFD. (E and F) One-way ANOVA was used for comparing different groups. Ctrl, control; DB, diabetic.

