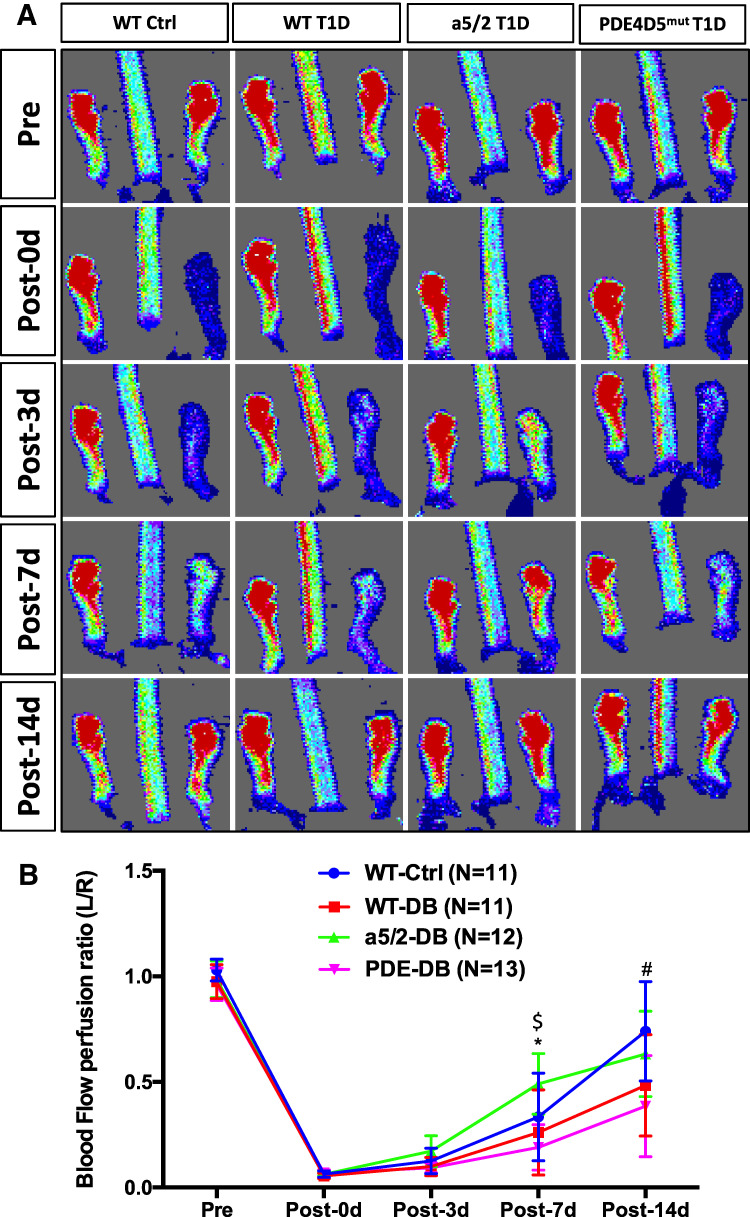
Figure 4.
Blood-flow recovery after HLI surgery. (A) Representative laser Doppler image of blood flow before and after HLI. (B) Quantification of ratio of blood flow in the ischemic to the control foot measured by laser Doppler scan at indicated times. Analysis was by one-way ANOVA. WT control, n = 11 mice; WT T1D, n = 11; integrin α5/2 T1D, n = 12; and PDE4Dmut T1D, n = 13. *Between WT T1D and integrin α5/2 T1D, P < 0.003; $between integrin α5/2 T1D and PDE4Dmut T1D, P < 0.0027; #between integrin α5/2 T1D and PDE4Dmut T1D, P < 0.0474. Ctrl, control.

