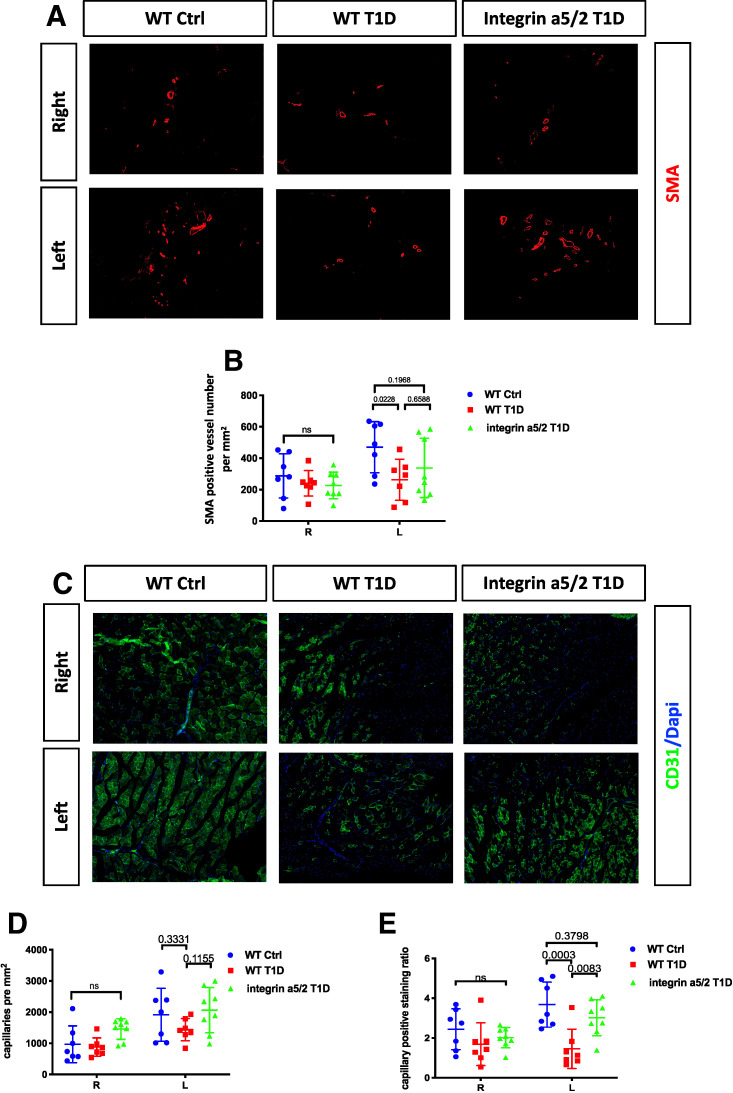
Figure 6.
Arteriogenesis and angiogenesis 14 days after femoral artery ligation. (A) Representative images of SMA staining of sections from ligated and control thighs. (B) Quantification of SMA-positive vessel number per mm2. (C) Representative images of CD31 staining of sections from ligated and control calves. (D) Quantification of capillary number per mm2. (E) Quantification of capillary area to whole-tissue area ratio. WT control, n = 7 mice; WT T1D, n = 7; and integrin α5/2 T1D, n = 8. (B and D) Two-way ANOVA was used. Ctrl, control.

