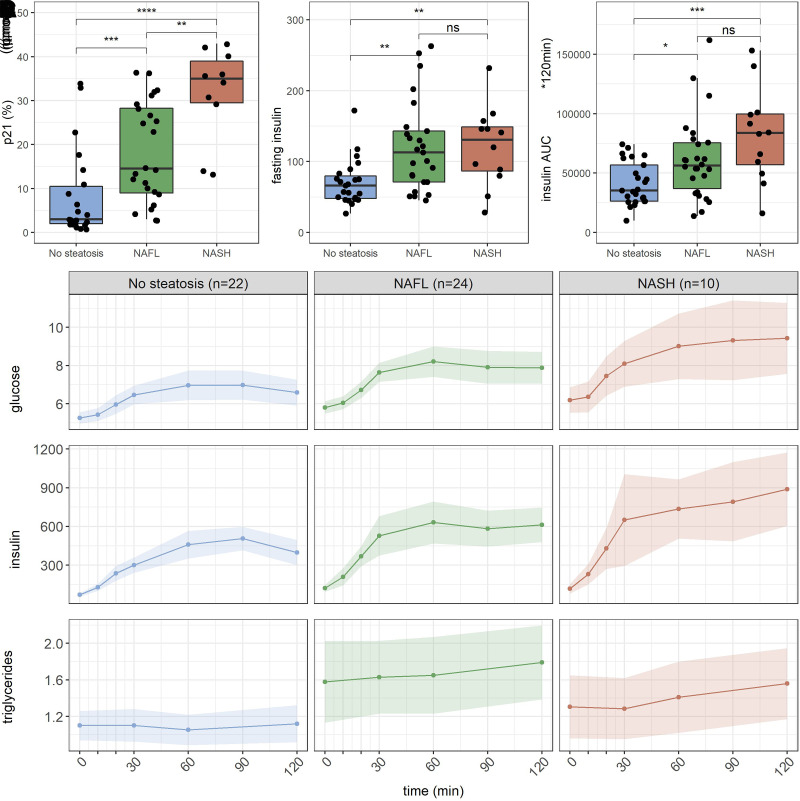
Figure 2.
A–C: Box plots showing p21 percentage, peripheral fasting insulin, and insulin AUC on the y-axis and the different categories of NAFL displayed on the x-axis (n = 56). D: Glucose, insulin, and triglyceride excursions during a 2-h MMT comparing individuals with no steatosis, NAFL, and NASH. Data are means ± 95% CIs. *P < 0.05, ** P < 0.01, ***P < 0.001.

