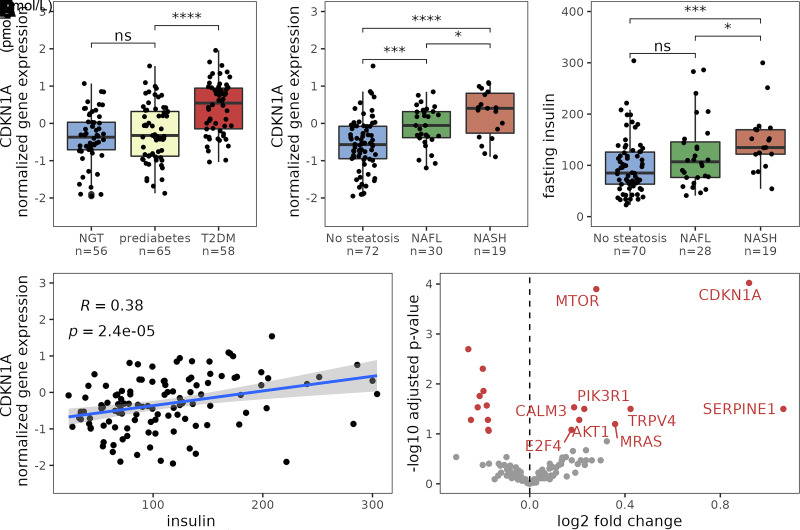
Figure 3.
Results from the validation cohort (n = 180). A: Hepatic CDKN1A expression in individuals with normal glucose tolerance (NGT), impaired fasting glucose, or T2DM. B: Box plot of hepatic CDKN1A expression in individuals with no steatosis, NAFL, and NASH. C: Peripheral fasting insulin concentrations in individuals without NAFL and with NAFL and NASH; individuals with T2DM were excluded from this analysis. D: Scatterplot displaying the relation between peripheral insulin and CDKN1A expression. Blue line is the linear prediction regression line; gray area is 95% CI, ρ is Spearman correlation coefficient, and P is the significance level; individuals with T2DM were excluded from this analysis. E: Volcano plot showing genes in the KEGG senescence pathway identified by RNA sequencing of liver biopsies. Genes in red indicate that the gene is significantly upregulated in individuals with fasting insulin levels in the highest quintile group. Adjusted for age; individuals with T2DM were excluded from this analysis. *P < 0.05, ** P < 0.01, ***P < 0.001.

