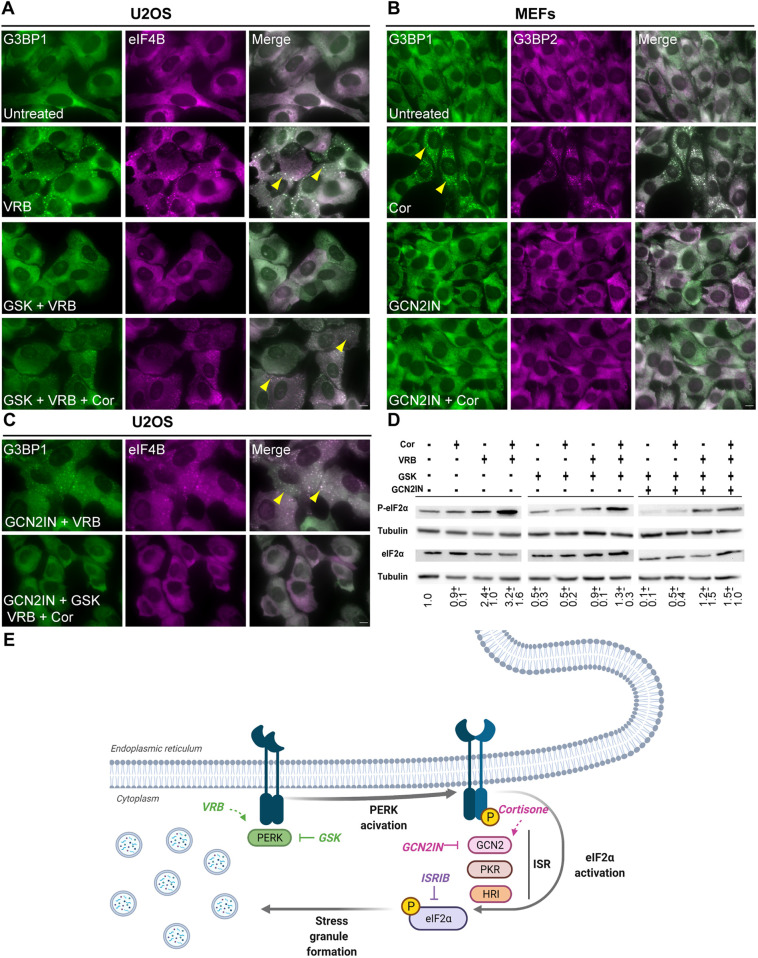
Fig. 8.
GSK blocks SG formation induced by VRB, whereas GCN2 inhibitor blocks cortisone-induced SGs in MEFs. (A) U2OS cells treated with the PERK inhibitor GSK (40 µM) for 2 h before addition of VRB (75 µM) or VRB (75 µM) and cortisone (Cor, 300 µM) for 1 h, as indicated. SGs are stained with antibodies to detect G3BP1 (green) and eIF4B (magenta). (B) MEFs treated with a GCN2 inhibitor (GCN2IN, 4 µM) for 2 h before Cor (300 µM) addition, as indicated. SGs are labeled with antibodies to detect G3BP1 (green) and G3BP2 (magenta). (C) U2OS cells treated with GCN2 inhibitor (4 µM) and GSK (40 µM) for 2 h before addition of VRB (75 µM) and Cor (300 µM) for 1 h, as indicated. SGs are labeled for G3BP1 (green) and eIF4B (magenta). In A–C, arrowheads indicate SGs. Scale bars: 10 µm. Images are representative of three experiments. (D) Western blot analysis of eIF2α and phosphorylated eIF2α (P-eIF2α) protein levels in U2OS cells after treatments with GCN2 inhibitor (4 µM) and GSK (40 µM) for 2 h before VRB (75 µM) and Cor (300 µM) addition for 1 h, as indicated. Tubulin was used as a loading control. This experiment is representative of three separate repeats. Mean±s.d. fold change is designated under the lanes; the analysis was performed by normalizing the ratio of P-eIF2α to eIF2α for each treatment group to that of the untreated group. (E) Scheme depicting the ISR pathway and SG formation by VRB and cortisone.

