Figure 4.

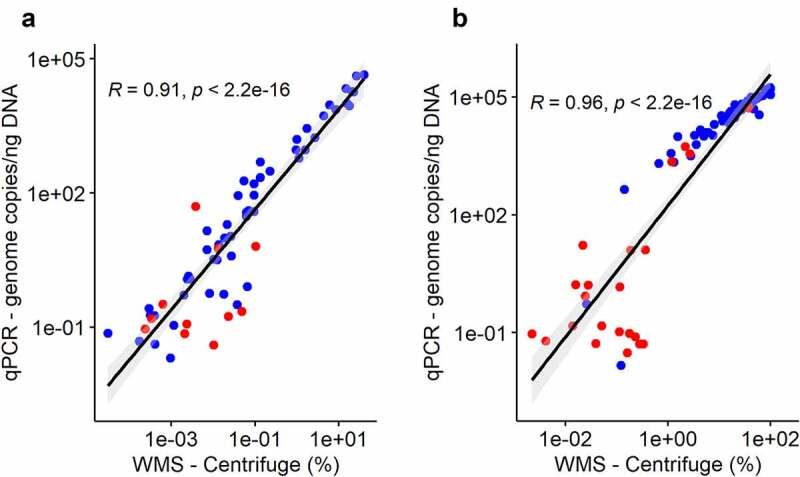
Correlation of Kp abundances quantified by qPCR vs WMS (Centrifuge) in Direct samples (a) and Sweep samples (b). R = Spearman’s rho. Blue = SCAI culture positive, Red = SCAI culture negative.

Correlation of Kp abundances quantified by qPCR vs WMS (Centrifuge) in Direct samples (a) and Sweep samples (b). R = Spearman’s rho. Blue = SCAI culture positive, Red = SCAI culture negative.