
Figure 5.
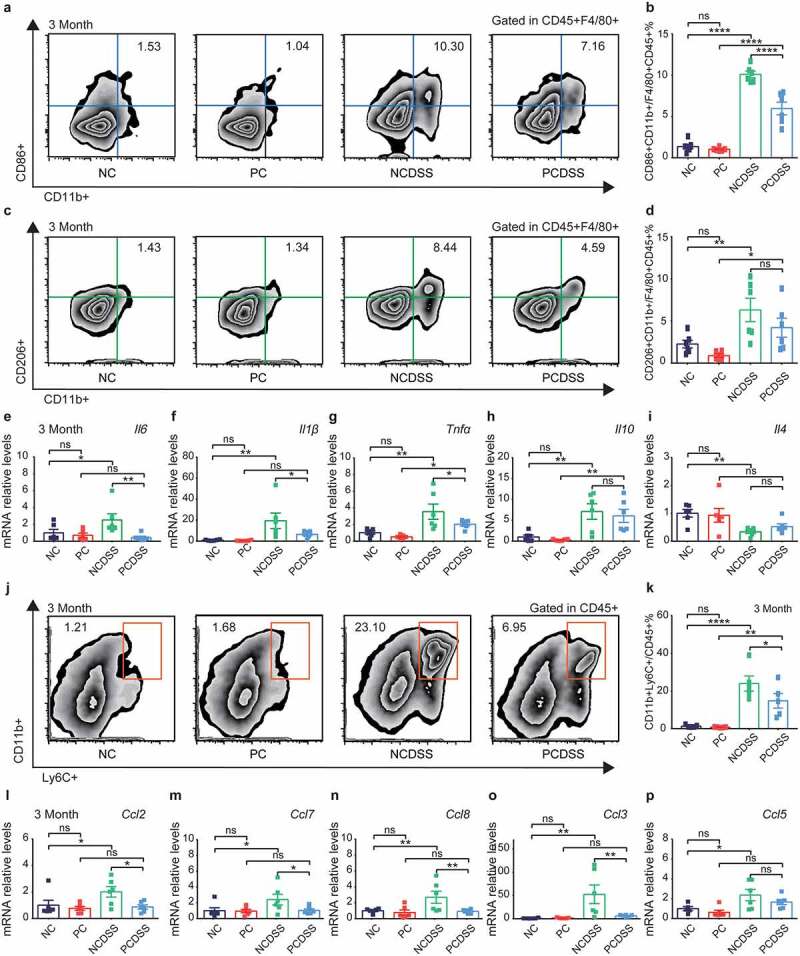
Cholecystectomy inhibits monocytes/macrophages recruitment to relieve colitis in mice. Mice were induced colitis by DSS treatment at third month after cholecystectomy. a-b. Representative flow cytometric plots (a) and quantitative analysis (b) of the colonic CD45+ F4/80+ CD11b+ CD86+ macrophages. c-d. Representative flow cytometric plots (c) and quantitative analysis (d) of the colonic CD45+ F4/80+ CD11b+ CD206+ macrophages. e-g. Relative mRNA expression of proinflammatory cytokines Il6 (e), Il1β (f) and Tnfα (g) in colon tissues. h-i. Relative mRNA expression of anti-inflammatory cytokines Il10 (h) and Il4 (i) in colon tissues. j-k. Representative flow cytometric plots (j) and quantitative analysis (k) of the colonic CD45+ CD11b+ Ly6C+ monocytes. l-p. Relative mRNA expression of chemokines Ccl2 (l), Ccl7 (m), Ccl8 (n), Ccl3 (o) and Ccl5 (p) in colon tissues. Data are represented as mean ± SEM. N = 5–6 per group. *P < .05, **P < .01, ***P < .001, ****P < .0001. ns: not significant. Ccl, chemokine (C-C motif) ligand; DSS, dextran sulfate sodium; Il, interleukin; NC, normal control; NCDSS, normal control with DSS; PC, Cholecystectomy; PCDSS, Cholecystectomy with DSS; Tnfα, tumor necrosis factor α.