Fig. 5.
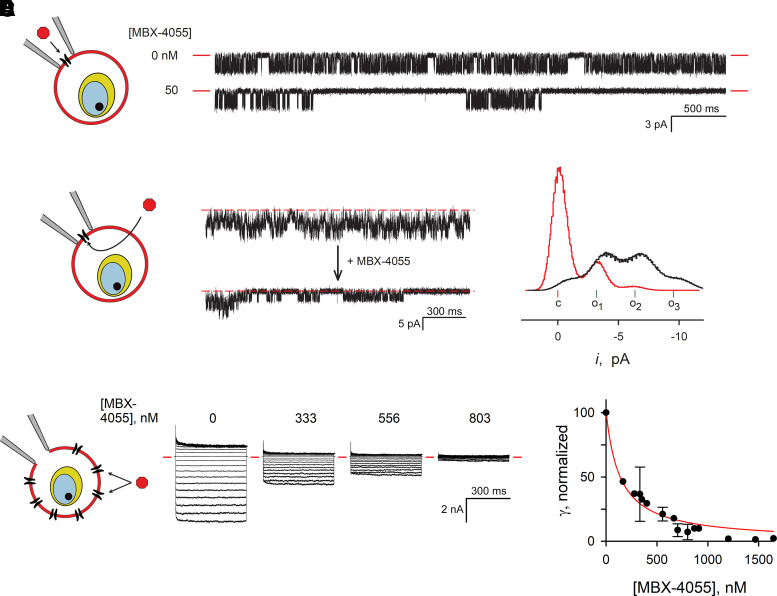
Direct MBX-4055 action on PSAC in cell-attached and whole-cell patch-clamp. (A) Single channel recordings from trophozoite-infected erythrocytes at a -100 mV membrane voltage (Vm) with indicated [MBX-4055] added symmetrically to bath and pipette solutions. Red dashes indicate closed channel level. Note the long-blocked events when MBX-4055 is present. The schematic on the left shows the cell-attached patch-clamp configuration; inhibitor added to the pipette solution has direct access to channels in the membrane patch. (B) Cell-attached recording from a 3-channel patch before and after bath addition of MBX-4055 (top and bottom traces, respectively; final bath concentration, 210 nM). Vm, -100 mV. Dashed red lines represent zero current, observed when all three channels are closed. Schematic shows inhibitor must cross the membrane to access channels in the patch. (C) All-points histogram of currents from the recordings in panel B tallied from 18.7 seconds of recording before and after MBX-4055 addition (black and red traces, respectively). The current levels corresponding to all channels closed (c), and 1, 2, or 3 channels open (o1, o2, o3) are indicated. (D) MBX-4055 dose-response experiments, determined using the whole-cell patch clamp method. Ensemble currents in response to Vm between -100 and +100 mV, applied in 10 mV increments, are shown from a single cell before and after sequential addition of MBX-4055 to indicated concentrations. Red dashes indicate zero current levels. Schematic illustrates this configuration with inhibitor addition to bath. (E) Mean ± S.D. chord conductance (γ) calculated from currents between Vm of -100 and 0 mV, normalized to 100 without inhibitor; all measurements from 4 cells were pooled. Red line, best fit to Langmuir isotherm, γ = a/(1 + (x/K0.5)).

