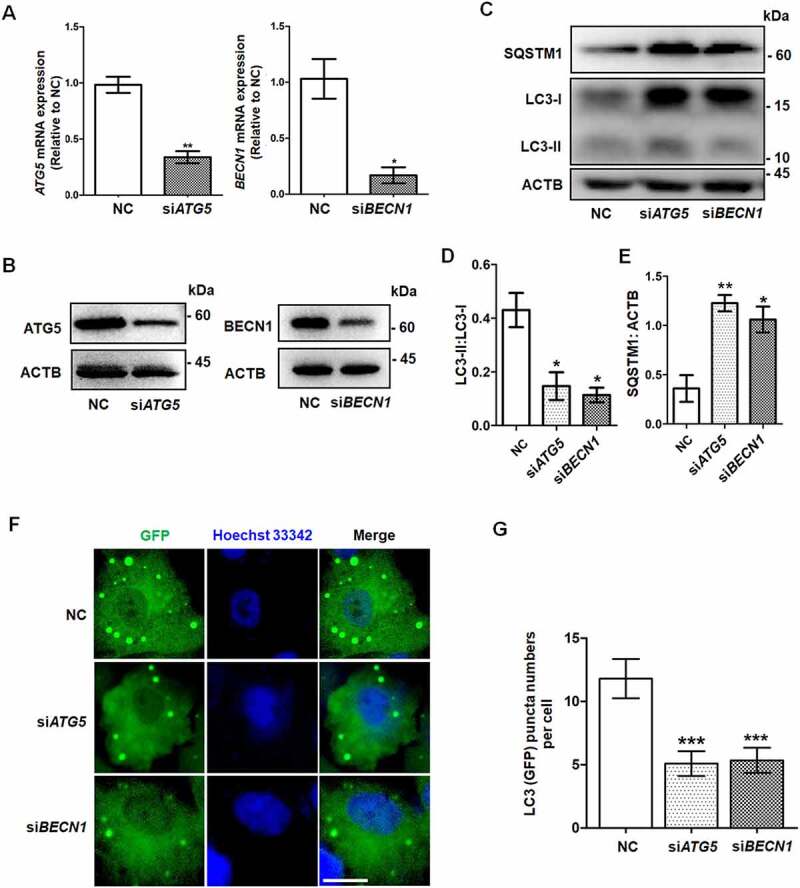
Figure 1.

Knockdown of ATG5 and BECN1 inhibited autophagy in GCs. The negative control siRNA (NC), ATG5 siRNA (siATG5), and BECN1 siRNA (siBECN1) were transfected into KGN cells, and 48 h later the knockdown efficiencies were determined in both mRNA (A) and protein (B) levels. GAPDH and ACTB/β-actin served as the internal control for mRNA and protein, respectively. Data are presented as mean ± SD, n = 3, *P < 0.05, **P < 0.01 vs. NC. (C) The expression of LC3 and SQSTM1 proteins in these three groups was detected by Western blot. ACTB was used as the loading control. Quantitative analysis showed lower LC3-II:LC3-1 ratios (D) and higher levels of SQSTM1 (E) in the siATG5 and siBECN1 groups, compared to the NC group. Data are presented as mean ± SD, n = 3, *P < 0.05, **P < 0.01. (F) KGN cells were transfected with NC, siATG5, and siBECN1 for 24 h, followed by infection with LC3 reporter adenovirus for 48 h. The distribution of green (GFP) LC3 puncta was observed under a fluorescence microscope after starvation for 6 h. Cell nuclei were counterstained with Hoechst 33342. Scale bar: 5 μm. (G) Quantification of green LC3 puncta in KGN cells of each group. Data are presented as mean ± SD, n = 3, ***P < 0.001.
