
Figure 1.
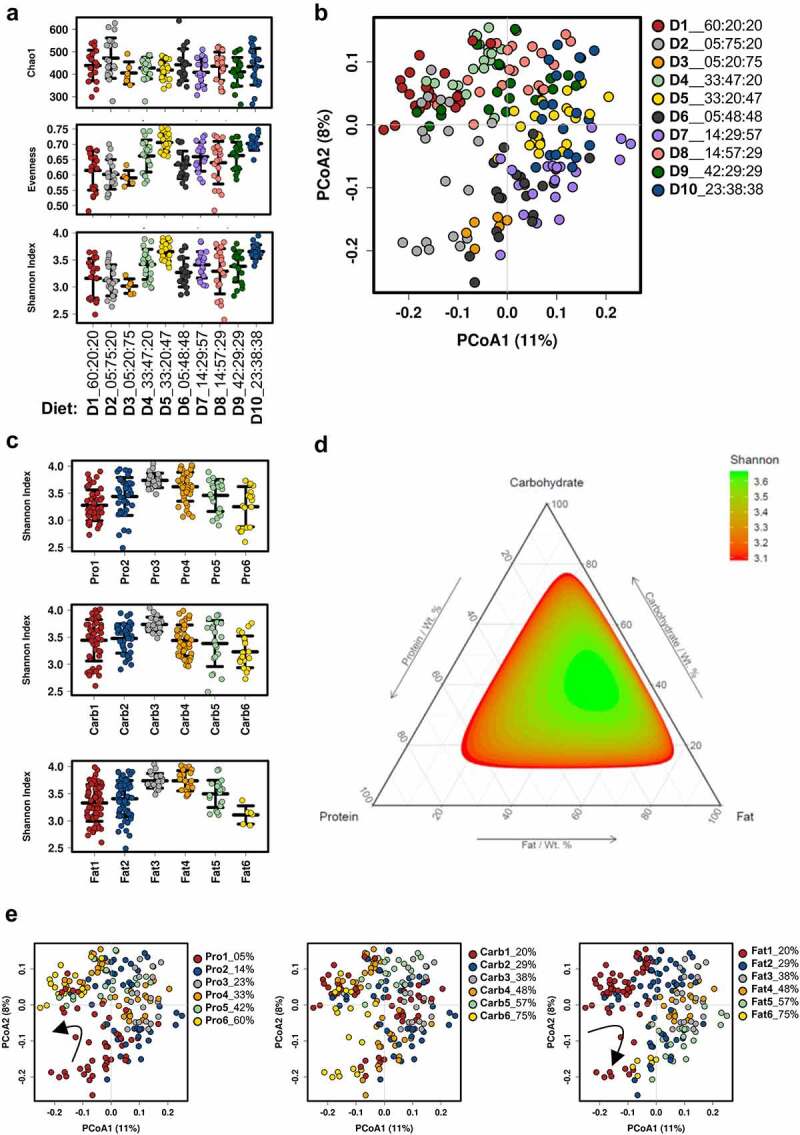
Effect of dietary macronutrient balance on the gut microbiota of mice. Control and PCOS-like mice were pooled for this analysis. (A) Measures of α-diversity: Chao1 species (OTU) richness, species evenness, and Shannon’s diversity index. Chao1 was not significantly different across diets (P = .14); however, species evenness (P < .0001) and Shannon’s diversity index (P < .0001) were significantly different across diets. Data are displayed as mean ± SEM and were analyzed by ANOVA (n = 6–20 mice/diet). X-axis denotes P:C:F ratio of each diet. (B) Principal coordinate analysis (PCoA) of the Bray-Curtis resemblance matrix generated from square-root transformed relative abundances at the OTU level (β-diversity). Proportion of variance explained by each principal coordinate (PCo) is denoted on the corresponding axis in parenthesis. Microbial composition was found to be significantly different (R2 = 0.25, P < .001) across diets using adonis (n = 6–20 mice/diet). (C) Measure of α-diversity indicated by Shannon’s diversity index with different macronutrient composition groups classified by color from 1–6 in ascending order for % protein, % carbohydrate and % fat content in diet (Table S2). Data indicate that all three macronutrients significantly impact gut microbial α-diversity (all P < .0001). Data are mean ± SEM and were analyzed by ANOVA (n = 6–60 mice/group). (D) Ternary plot of Shannon’s diversity index combining protein, carbohydrate and fat content showing a maximal peak of α-diversity at a specific ratio of protein, carbohydrate, and fat in the diet. E, PCoA of Bray-Curtis resemblance matrix (β-diversity) for dietary content of protein, carbohydrate, and fat. Microbial composition was found to be significantly different across protein groups (R2 = 0.15, P < .001), carbohydrate groups (R2 = 0.12, P < .001), and fat groups (R2 = 0.14, P < .001) using adonis (n = 6–60 mice per group). PCoA plots for the available amount of dietary protein and fat in the diet show that microbial β-diversity shifts gradually as each of these macronutrients increase in diet (arrows) .