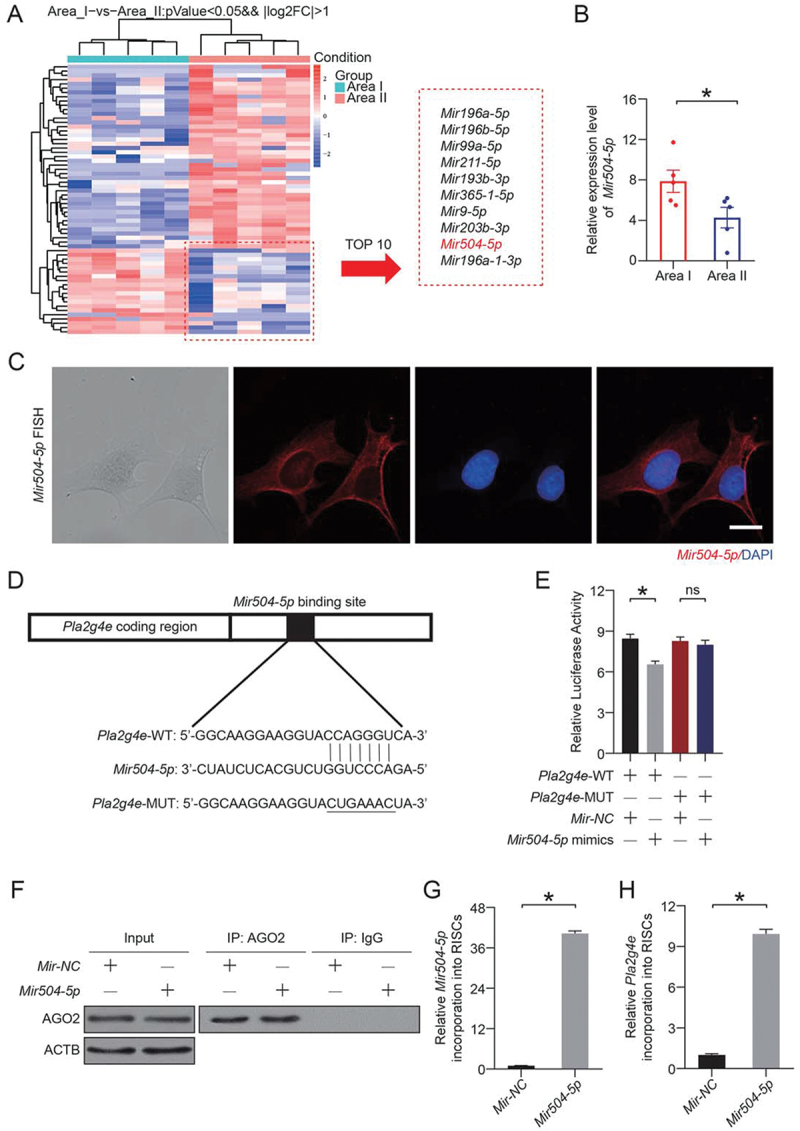
Figure 7.

Mir504-5p downregulated Pla2g4e by directly targeting the 3’-UTR. (A) Heatmap showing differentially expressed microRNAs between area I and area II on postoperative day 7. (B) Relative expression level of Mir504-5p in area I and area II on postoperative day 7. Data are presented as the mean ± SEM (n = 5). (C) FISH assay of Mir504-5p in DMECs without any treatment. Scale bars: 20 μm. (D-E) Luciferase reporter assay and comparison of the relative luciferase activity in DMECs treated with Pla2g4e-WT, Pla2g4e-MUT, Mir-NC or Mir504-5p mimic for 48 h. Data are presented as the mean ± SEM (n = 6). (F) Immunoprecipitation of RISC in DMECs overexpressing Mir-NC or Mir504-5p with the Pan-AGO2 antibody. IgG was employed as a negative control, and ACTB was employed as an internal control. (G) Relative mmu-Mir504-5p incorporation into RISC in DMECs overexpressing Mir-NC or Mir504-5p. Data are presented as the mean ± SEM (n = 6). (H) Relative Pla2g4e incorporation into RISC in DMECs overexpressing Mir-NC or Mir504-5p. Data are presented as the mean ± SEM (n = 6). Significance: *p < 0.05.
