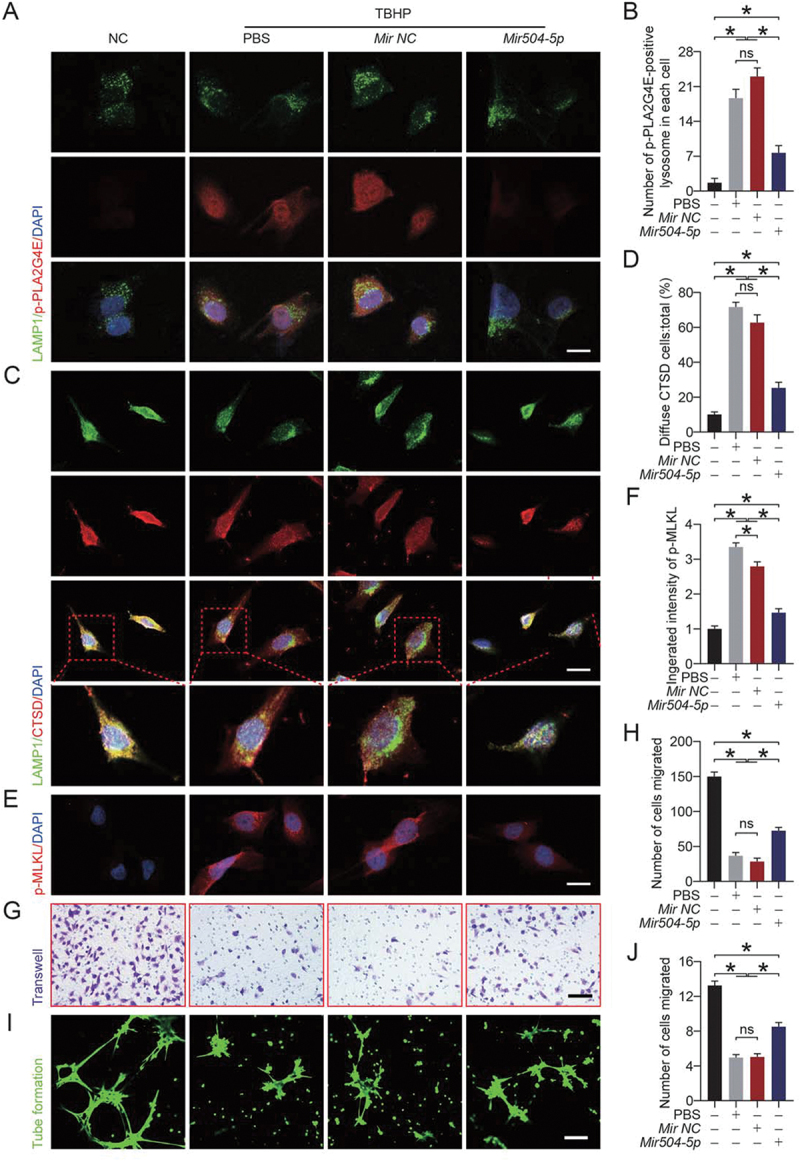
Figure 8.

Overexpression of Mir504-5p suppressed PLA2G4E and protected the function of HUVECs. (A) Immunofluorescence staining of LAMP1 and p-PLA2G4E in HUVECs exposed to different treatments for 24 h (NC, TBHP, TBHP + Mir-NC or TBHP + Mir504-5p mimic). Scale bars: 20 μm. (B) Comparison of the number of p-PLA2G4E-positive lysosomes in each HUVEC among the four groups. Data are expressed as the means ± SEM (n = 6). (C) Immunofluorescence staining of LAMP1 and CTSD in HUVECs exposed to different treatments for 24 h (NC, TBHP, TBHP + Mir-NC or TBHP + Mir504-5p mimic). Scale bars: 20 μm. (D) Comparison of the ratio of diffuse CTSD cells (refer to HUVECs) among the four groups. Data are expressed as the means ± SEM (n = 6). (E) Immunofluorescence staining of p-MLKL in HUVECs exposed to different treatments for 24 h (NC, TBHP, TBHP + Mir-NC or TBHP + Mir504-5p mimic). Scale bars: 20 μm. (F) Quantification of the integrated intensity of p-MLKL in HUVECs. Data are expressed as the means ± SEM (n = 6). (G) Cell migration assays were performed on HUVECs after 24 h of different treatments (NC, TBHP, TBHP + Mir-NC or TBHP + Mir504-5p mimic), and the presented results were obtained after 12 h of culture. Scale bars: 200 μm. (H) Quantification and analysis of the number of migrated cells (refer to HUVECs). Data are expressed as the means ± SEM (n = 6). (I) An in vitro angiogenesis (tube formation) assay was performed on HUVECs after 24 h of different treatments (NC, TBHP, TBHP + Mir-NC or TBHP + Mir504-5p mimic), and the presented results were obtained after 6 h of culture. Scale bars: 200 μm. (J) Quantification and analysis of tube length (pixels; ×104). Data are expressed as the means ± SEM (n = 6). Significance: *p < 0.05.
