Figure 2.

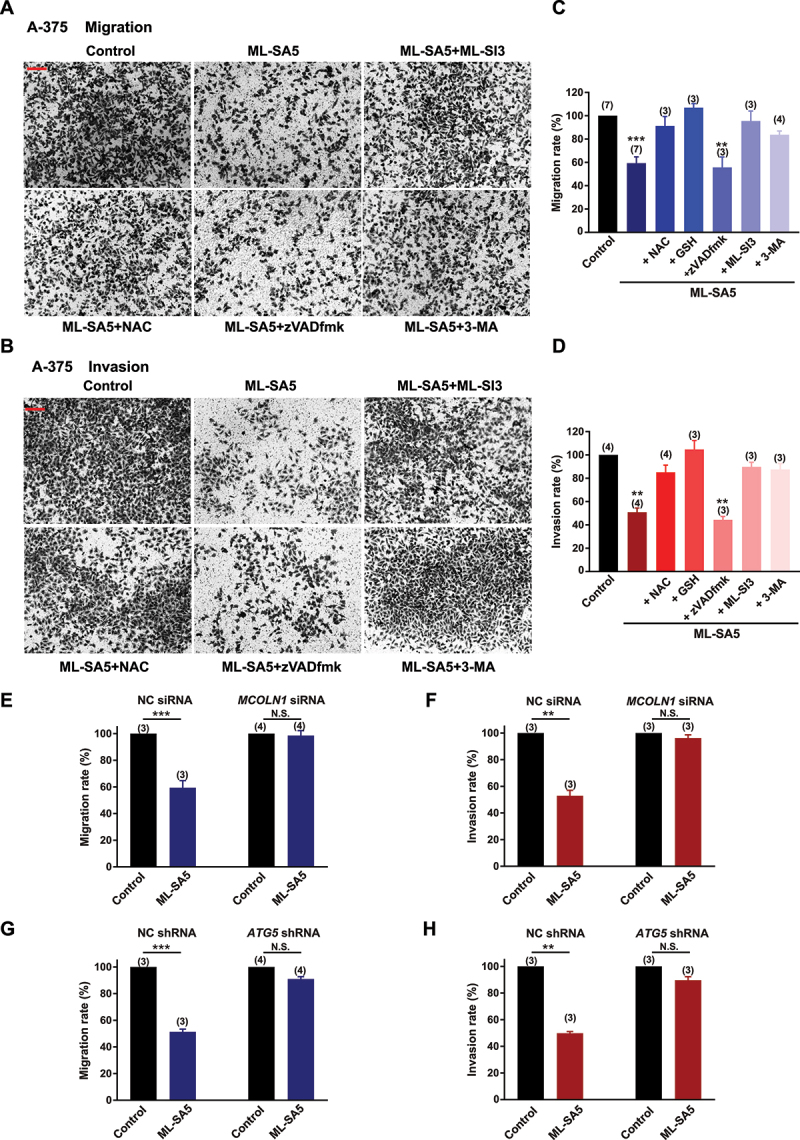
Autophagy inhibition by MCOLN1 profoundly suppresses migration and invasion of A-375 cells. (A, B) Representative images showing that migrated (A) or invaded (B) A-375 cells stained with 0.5% crystal violet solution, under the control, ML-SA5 (5 µM), ML-SA5 + ML-SI3 (20 µM), ML-SA5 + NAC (5 mM), ML-SA5 + zVADfmK (20 µM), and ML-SA5 + pretreatment of 3-MA (10 mM for 2 h), as evaluated using transwell assays. All treatments were for 16–24 h. Scale bar: 1 cm. (C, D) Migration rate (OD600x is normalized to OD600control) (C) and invasion rate (D) of A-375 cells were summarized under different conditions indicated. n = 3–7. (E, F) Comparison of migration rate (E) or invasion rate (F) of A-375 cells between the control and ML-SA5 treatment (5 µM) in groups transfected with negative control (NC) siRNA or MCOLN1 siRNA. n = 3–4. (G, H) Knockdown of ATG5 strongly abolished the effects of ML-SA5 (5 µM) on suppressing migration (G) and invasion (H) of A-375 cells. n = 3–4. Means ± SEMs are shown in panels C–H. Significant differences were evaluated using one-way ANOVA followed by Tukey’s test. **P < 0.01; ***P < 0.001.
