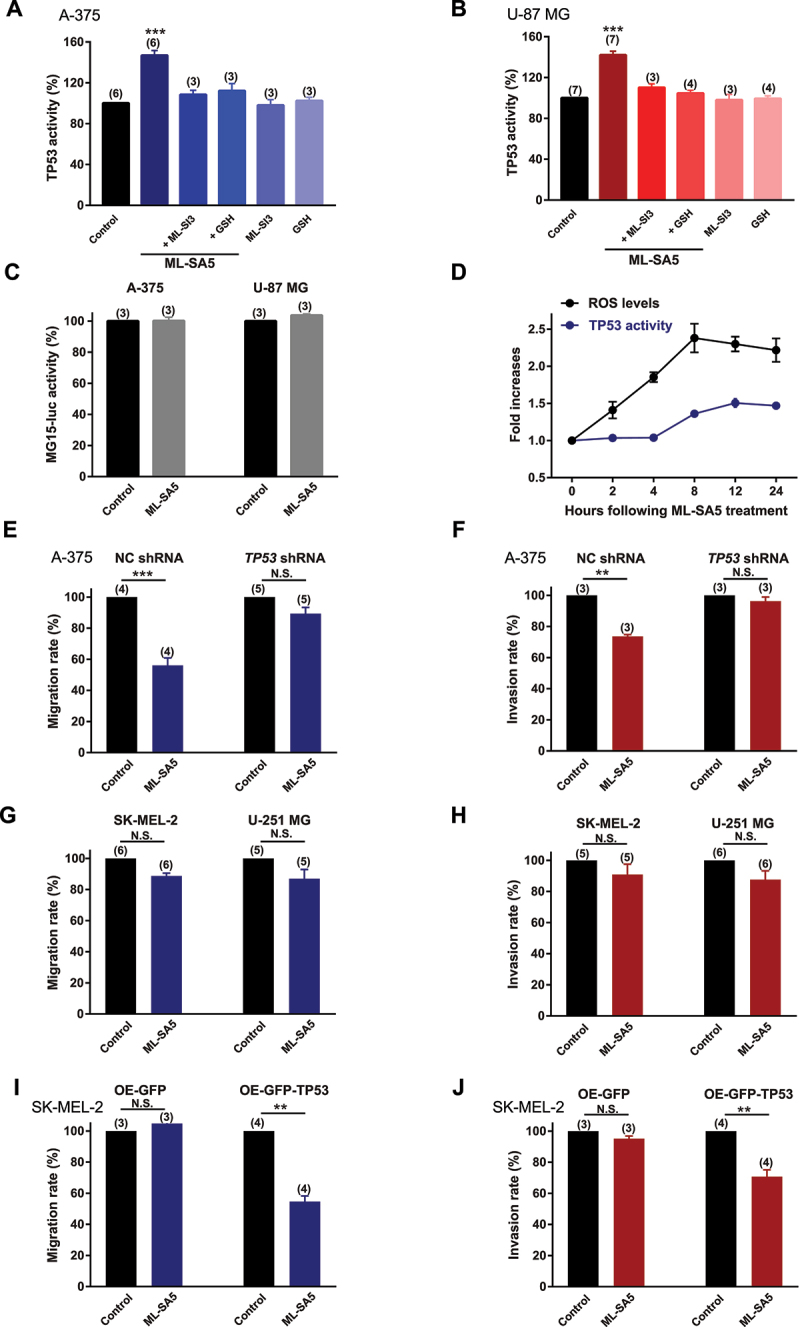
Figure 7.

ROS elevation induced by MCOLN1-mediated autophagy inhibition elicits TP53 activity. (A, B) TP53 activity in A-375 (A) or U-87 MG (B) cells was evaluated by monitoring the fluorescence intensity of PG13-luc that is a luciferase reporter containing WT TP53 binding sites, under the control, ML-SA5 (5 µM), ML-SA5 + ML-SI3 (20 µM), ML-SA5 + GSH (5 mM), ML-SI3 (20 µM), and GSH (5 mM). All treatments were for 24 h. n = 3–7. (C) ML-SA5 treatment (5 µM) did not alter the activity of MG15-luc, which is a luciferase reporter containing mutant TP53 binding sites, in A-375 and U-87 MG cells. n = 3. (D) Time course of the elevation in ROS levels and TP53 activity following ML-SA5 treatment (5 µM) in A-375 cells. n = 3. (E, F) Migration rate (E) (OD600ML-SA5 is normalized to OD600control) and invasion rate (F) of A-375 cells were compared between the control and ML-SA5 treatment (5 µM) in negative control (NC) shRNA or TP53 shRNA transfected groups. n = 3–5. (G, H) Migration rate (G) or invasion rate (H) of SK-MEL-2 and U-251MG cells were compared between control and ML-SA5 treatment (5 µM). Treatment with ML-SA5 was for 16 h-24 h. n = 5–6. (I, J) Migration rate (I) (OD600ML-SA5 is normalized to OD600control) and invasion rate (J) of SK-MEL-2 cells were compared between groups (control vs. ML-SA5 treatment (5 µM)) in overexpressing (OE) GFP or GFP-TP53 groups. n = 3–4. Means ± SEMs are shown in panels A–J. Significant differences were evaluated using one-way ANOVA followed by Tukey’s test. **P < 0.01; ***P < 0.001.
