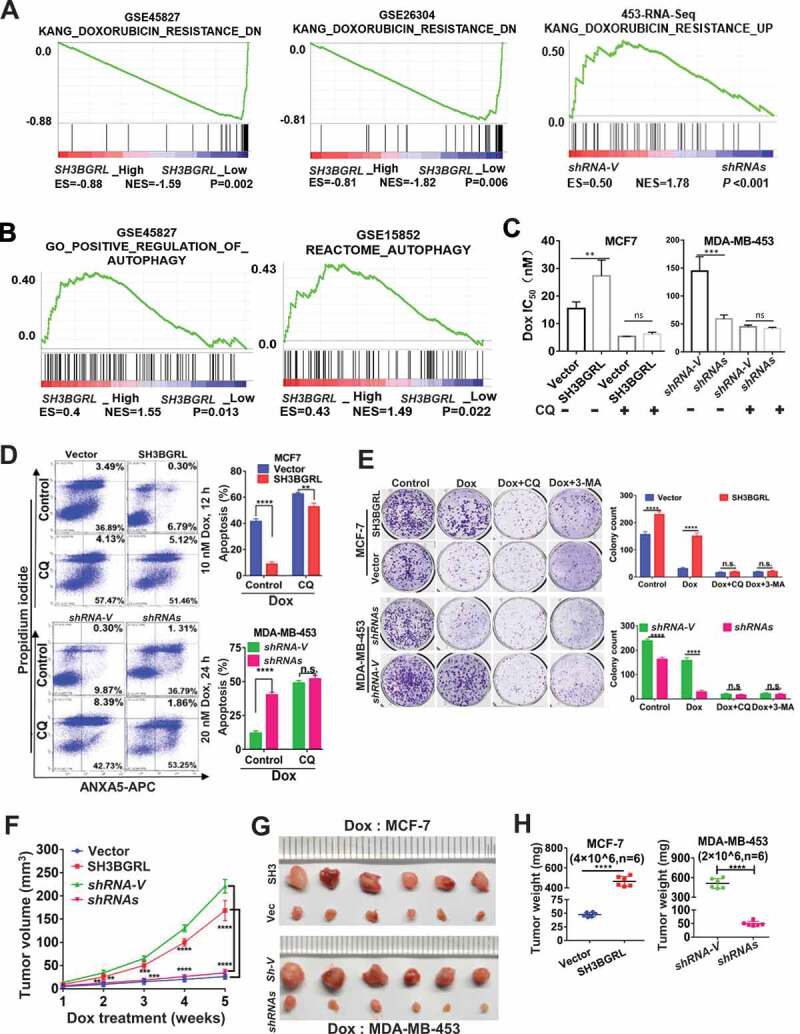
Figure 2.

SH3BGRL confers resistance to doxorubicin (Dox)-induced apoptosis through autophagy. (A) GSEA enrichment analysis of SH3BGRL expression and Dox resistance signature in public breast datasets (GSE45827,n = 130; GSE26304, n = 109) and MDA-MB-453 cells. (B) GSEA plots of SH3BGRL expression with autophagy gene signatures in public breast cancer datasets GSE45827(n = 130) and GSE15852 (n = 41). (C) IC50 of Dox in the indicated cells under combined treatment with CQ or without CQ. (D) Flow cytometry analyses of MCF-7 cells with SH3BGRL overexpression or MDA-MB-453 cells with SH3BGRL knockdown with their parental control cells treated with indicated concentrations of Dox and time with or without CQ. The left panels show the staining of ANXA5-FITC and PI, and the right ones present the quantification of apoptotic cells. (E) Colony formation of the cells as shown in (D) with treatments of Dox combined with CQ or 3-MA or without them (Control), respectively. The upper panels show representative images of generated colonies. Each experiment was independently repeated three times. (F-H) Xenograft model of MCF-7 and MDA-MB-453 tumor cells for tumor progression in nude mice. The growth curves of each tumor progression were measured by tumor volume (F), mean tumor weight of the dissected tumors after five weeks of tumor growth (G) and their weight statistical analysis (H). Six nude mice in each group were subcutaneously injected with indicated cells for 1 week, and the Dox treatment was conducted. All statistical analyses are shown as *P < 0.05, **P < 0.01, ***P < 0.001, ****P < 0.0001 and n.s, no significance, respectively.
