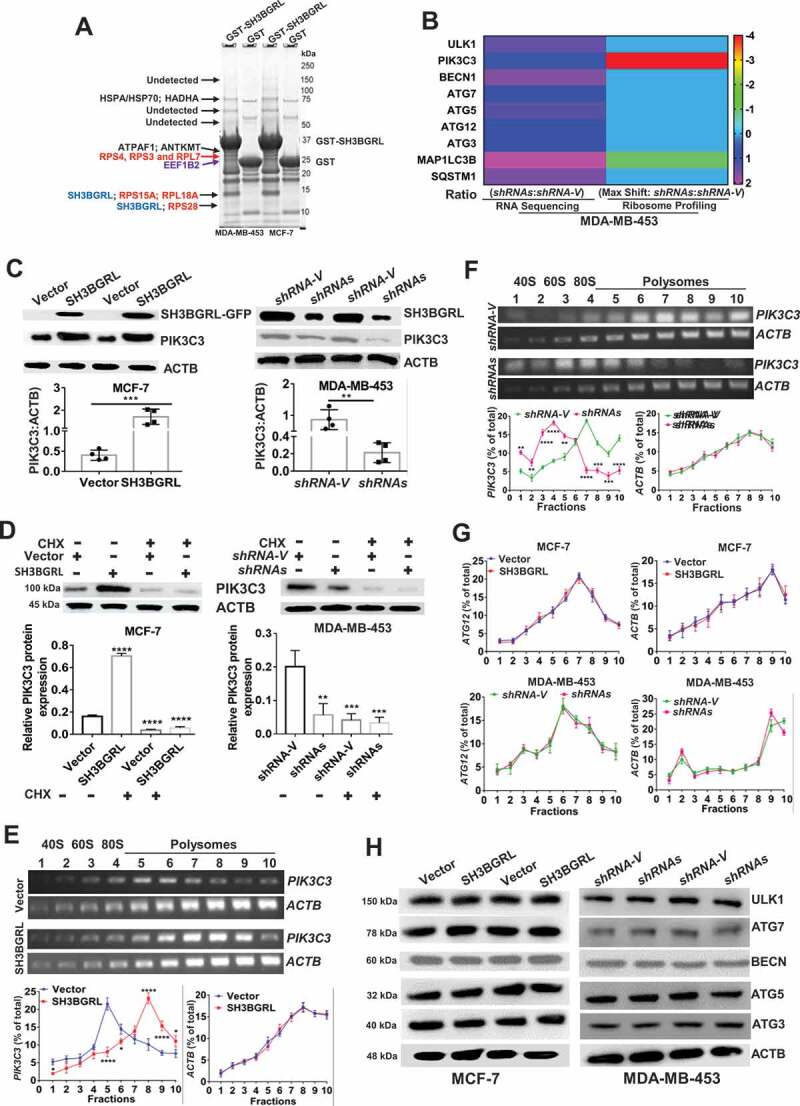
Figure 5.

SH3BGRL drives autophagy through PIK3C3 translation by interaction ribosome. (A) GST affinity isolation of SH3BGRL with ribosomal subunits. GST affinity isolation was performed with lysates of MCF-7 and MDA-MB-453 cells, followed by MS peptide sequencing. (B) Heatmap of RNA-seq and Polyribosome-profile analyses of ULK1, PIK3C3, BECN1, ATG7, ATG5, ATG3, MAP1LC3B and SQSTM1. (C) Immunoblots of SH3BGRL and PIK3C3 in indicated cells. ACTB was used as an internal loading control. Statistical analysis of PIK3C3 expression in indicated cells by four independent immunoblots. (D) Immunoblots of PIK3C3 protein in the indicated cells treated with or without 50 μg/ml cycloheximide (CHX) for 6 h. PIK3C3 expression was statistically analyzed based on three independent experiments. (E,F) Polyribosome profiling of PIK3C3 mRNA in MCF-7 (E) or MDA-MB-453 (F) cells. ACTB was used as an internal negative loading control. The marked numbers are equivalent to the collected fractions after gradient centrifuge. Fraction 1 represents the top (10%) of the gradient, fraction 10 represents the bottom (50%) of the gradient. (G) Polyribosome profiling of ATG12 mRNA in indicated cells as (E). All experiments were independently repeated at least three times. (H) Immunoblots of ULK1, BECN1, ATG7, ATG5 and ATG3 in the indicated cells. ACTB was used as a loading control. All significant differences are shown as *P < 0.05, **P < 0.01, ***P < 0.001, ****P < 0.0001.
