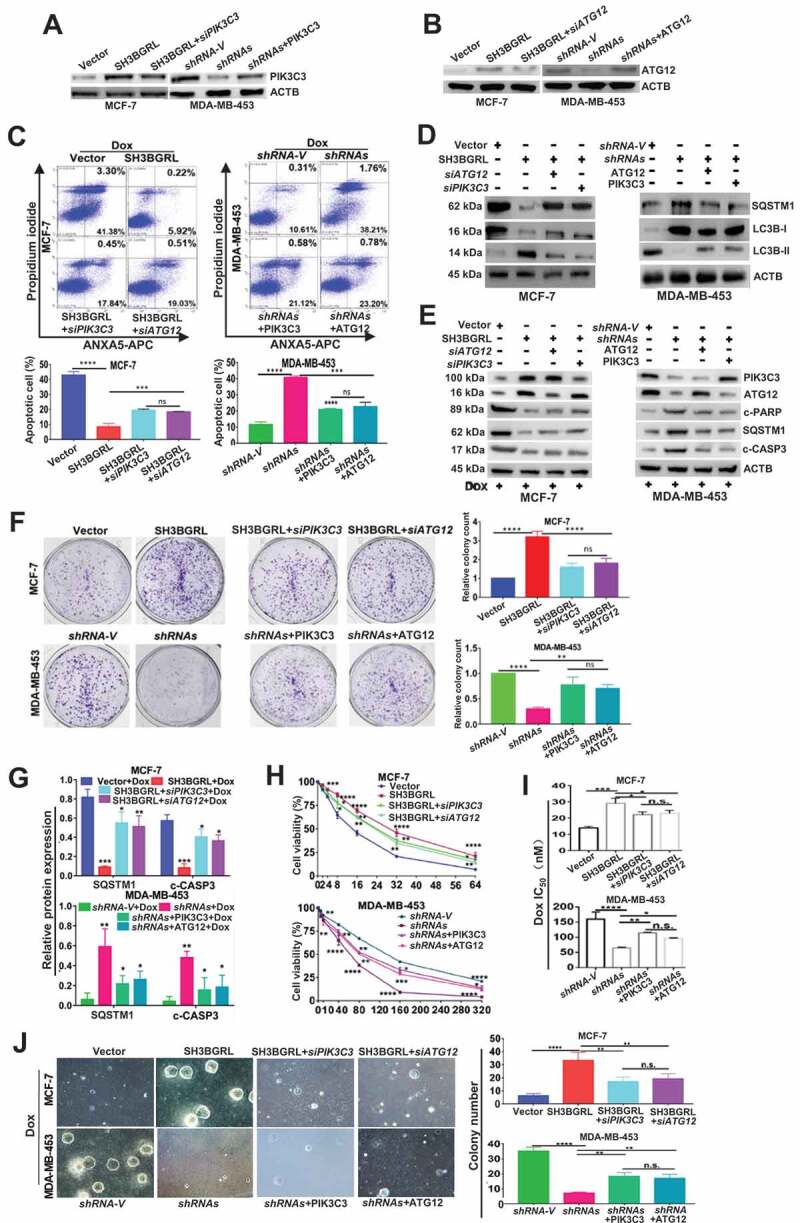
Figure 7.

PIK3C3 and ATG12 contribute to SH3BGRL-mediated Dox resistance. (A,B) Immunoblots of PIK3C3 (A) and ATG12 (B) in indicated cells. ACTB served as the loading control. (C) Flow cytometry analysis of the indicated MCF-7 series cells. 10 nM or 20 nM Dox was used to treat MCF-7 or MDA-MB-453 cells for 12 h or 24 h, respectively. The left panel shows the staining of ANXA5-FITC and PI. The right panel is the quantification of apoptotic cells. (D) Immunoblots of the indicated autophagy markers in MCF-7-SH3BGRL overexpression cells with either ATG12 or PIK3C3 knockdown, or in MDA-MB-453-SH3BGRL knockdown cells with either ATG12 or PIK3C3 forced expression. (E) Immunoblots of SQSTM1 and the cleaved CASP3 in the above cells in (C). MCF-7 cells were treated with 10 nM Dox for 12 h, and MDA-MB-453 cells with 20 nM Dox for 24 h. (F) Representative images of colonies formed by indicated cells with10 nM or 20 nM Dox treatment. The right panel shows the quantification of colony formation. Colonies with more than 60 cells were scored. (G) Statistical SQSTM1 and the cleaved CASP3 expression by three independent experiments. 10 nM Dox was used for MCF-7 cells, and 20 nM for MDA-MB-453 cells. (H) Cell viability analysis of indicated cells under treatment with Dox at various concentrations, combined with or without CQ for 24 h. (I) IC50 of the indicated cells under treatment as in (D). (J) Representative images of soft agar colonies of the indicated cells after treatments with10 nM or 20 nM Dox treatment for 48 h (Left panel). Quantification of soft agar colony is shown in the right panel. Colonies (larger than 0.1 mm diameter) were quantified after 18 days of culture. Significant differences are shown as *P < 0.05, **P < 0.01, ***P < 0.001, ****P < 0.0001, and n.s means no significance.
