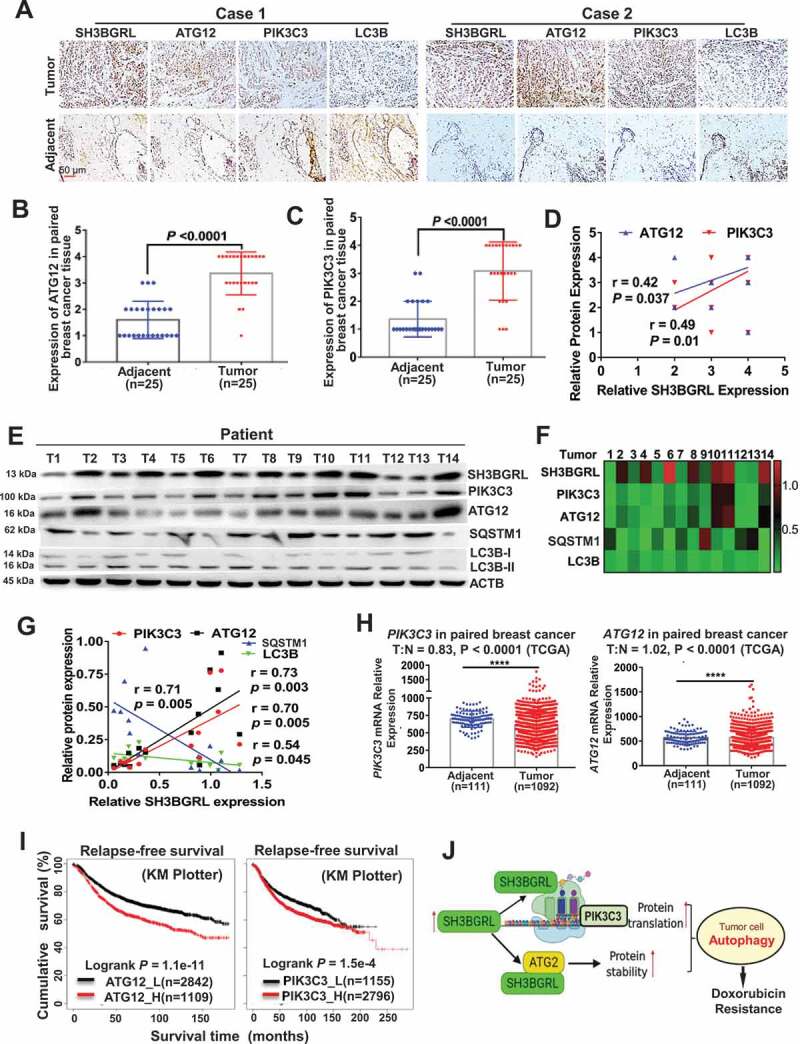
Figure 9.

Activation of SH3BGRL-PIK3C3/ATG12 autophagy axis in breast cancer patients. (A). Representative IHC staining of SH3BGRL, ATG12, PIK3C3 and LC3B expressions in 25 primary breast cancer specimens along with the matched adjacent normal tissues. Scale bar: 50 µm. (B,C) Statistical analysis of ATG12 (B) and PIK3C3 (C) in tissues of (A). (D) Correlation analysis of SH3BGRL protein level to that of ATG12 (r = 0.42; P = 0.037) or PIK3C3 (r = 0.49; P = 0.01) in breast cancer tissues in (A). (E) Immunoblots of the indicated proteins in 14 fresh breast cancer specimens. ACTB was used as a loading control. (F) Heatmap of protein expression of SH3BGRL, PIK3C3, ATG12, SQSTM1, and LC3B protein band intensity in (E), which was quantified and analyzed with densitometry and Image J software. (G) Correlation analysis of SH3BGRL protein level with that of PIK3C3, ATG12, SQSTM1 or LC3B in (F). (H) Marginal elevation of PIK3C3 mRNA expression in breast cancer tissues, compared with normal breast tissues (T = 1092, N = 111;T:N = 0.83, P < 0.0001; TCGA) and ATG12 mRNA (T = 1092, N = 111;T:N = 1.02, P < 0.0001; TCGA). (I) Kaplan–Meier relapse-free survival curves of breast cancer patients based on mRNA of ATG12 (n = 3951; P = 1.1e-11) or PIK3C3 (n = 3951; P = 1.5e-4). (J) Schematic mechanism of SH3BGRL-PIK3C3/ATG12 autophagy on doxorubicin resistance in breast cancer. All statistical analyses are shown as ****P < 0.0001.
