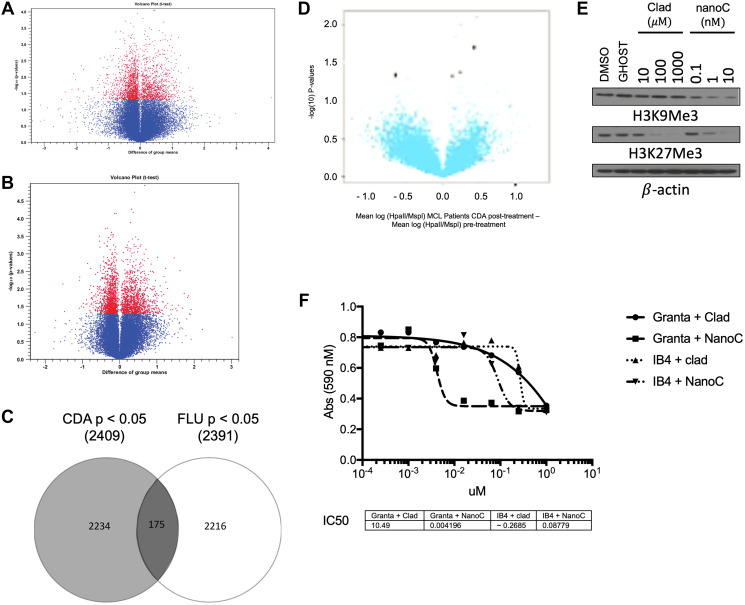
Figure 1. Cladribine has a unique epigenetic signature that affects DNA and histone methylation.
(A) Plot of gene expression difference (X axis) vs. Significance (on Y axis) showing selected differentially expressed probes between CLL patients after treatment with fludarabine as compared to before it. Probe sets that were differentially methylated are marked in red (p < 0.05). Total 2 patients. (B) Plot of gene expression difference (X axis) vs. Significance (on Y axis) showing selected differentially expressed probes between MCL and CLL patients after treatment with cladribine as compared to before it. Probe sets that were differentially methylated are marked in red (p < 0.05). Total 3 patients (2 MCL). (C) A Venn diagram showing overlap between changed methylation state of genetic loci of fludarabine and cladribine (p < 0.05). (D) Volcano plot of methylation difference (X axis) vs. Significance (on Y axis) (using HELP) showing selected differentially methylated loci between patients after study treatment as compared to before it. Probe sets that were differentially methylated are marked in black (p < 0.05). Total 6 MCL patients. (E) Immunoblot of Granta 519 cells post 48 hours of treatment with increasing concentrations of cladribine (Clad) vs nanoliposome encapsulated cladribine (NanoC) assayed for H3K9Me3 and H3K27Me3. β-actin is loading control. (F) Cell viability by MTS assay of Granta 519 (Granta) and IB4 cells after 48 hours of treatment with varying doses of clad or NanoC. * p < 0.05 for Granta 519 cells. # p < 0.05 for IB4 cells.

