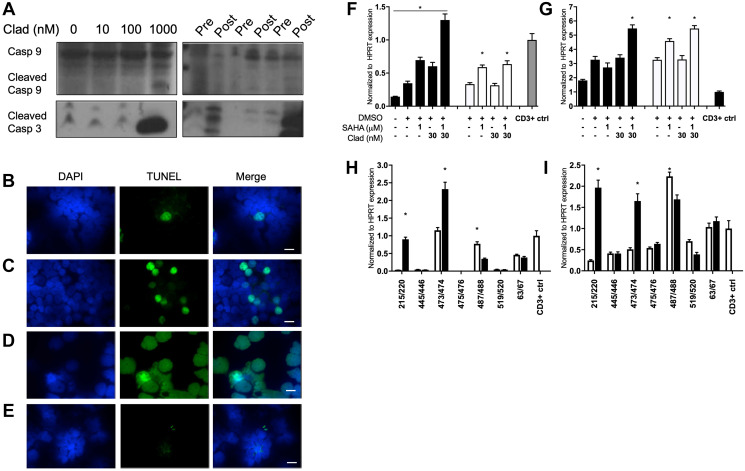
Figure 3. Cladribine and SCR therapy minorly increased apoptosis and signatures of ADCC in MCL.
(A) (Left) Immunoblot of Granta 519 cells for cleaved caspase 3 and 9 after 48 hour treatment with increasing concentrations of cladribine. (Right) Three pairs of MCL patient samples assessed for caspase 9 and 3 levels before and after 5 days of SCR treatment. Full length caspase 9 was used as loading control. TUNEL staining for apoptosis of MCL patient (B) pre treatment and (C) post treatment with SCR. (D) 353 cells treated with DNAse as positive control. Scale bar is 10 μM. (Blue, DAPI; Green, TUNEL stain). (E) TUNEL staining of TPLL cells post treatment with cladribine, vorinostat and alemtuzumab as negative control [23]. (F) qRT-PCR of NKL cells for granzyme B (GZMB) expression after treatment with combination vorinostat and cladribine at increasing doses for 48 (black) or 72 (white) hours. (G) qRT-PCR of NKL cells for perforin (PRF1) expression after treatment with combination vorinostat and cladribine at increasing doses for 48 (black) or 72 (white) hours. (H) qRT-PCR of MCL patient sample pairs before and 5 days after treatment with SCR for GZMB transcript. (I) qRT-PCR of MCL patient sample pairs before and 5 days after treatment with SCR for PRF1 transcript. * p < 0.05. NKL statistics are compared to DMSO treatment, and patient statistics are based on pre vs post treatment comparison. CD3 positive PBMCs were positive control.

