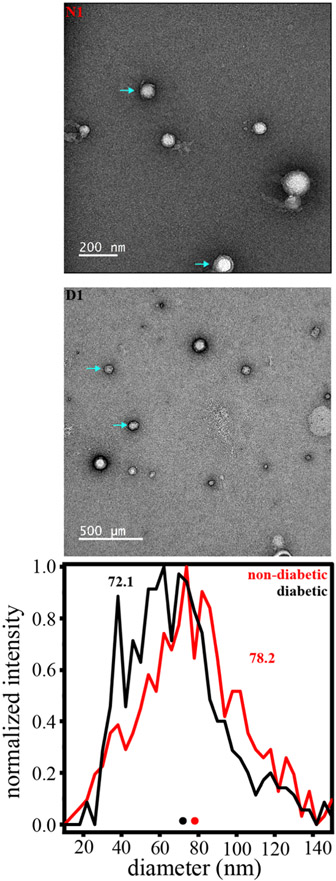
Figure 2.
(Top) EM images of both diabetic (D1) and nondiabetic (N1) exosome-enriched samples. (Bottom) Size distribution (shown in diameter) determined by analyzing 1012 particles across the EM images recorded for three separate diabetic and nondiabetic samples. Note: the particle diameter scale is in 4 nm increments, and deformed or clearly damaged particles as well as those clearly too small to be exosomes (below ~10 nm) were not included in this analysis.

