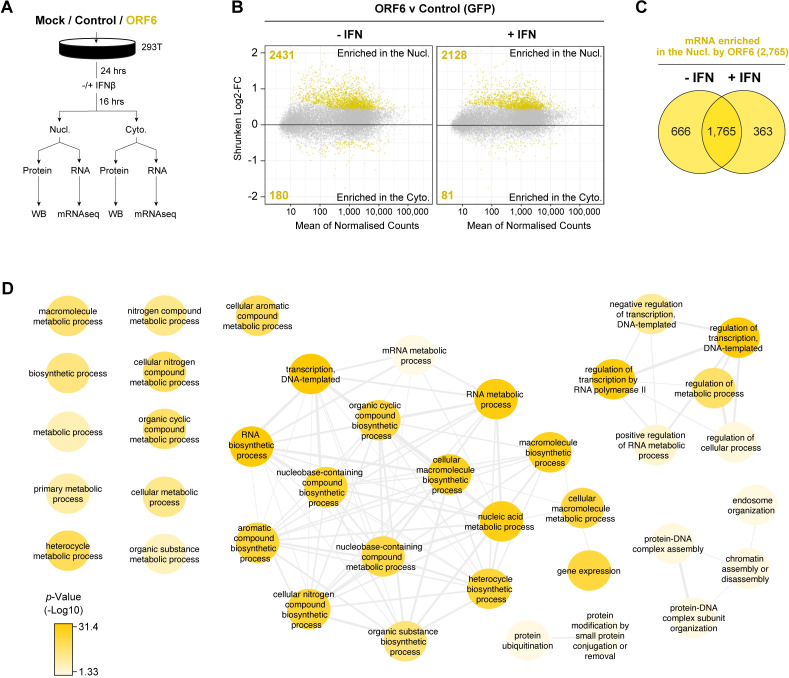
Fig 3. ORF6 inhibits the nuclear export of cellular mRNA.
HEK293T cells were transfected with pLVX-EF1α-GFP or pLVX-EF1α-ORF6 or left untransfected (mock). After 24h, cells were either treated with IFN-β (1,000 units/ml) for 16h or left untreated. Cells were then harvested and fractionated into nuclear (Nucl) and cytoplasmic (Cyto) fractions. Cells were either lysed for immunoblot analysis (see S4A Fig) or RNA was extracted for mRNAseq. (A) Schematic of experiment design. (B) The log2-fold change (Log2-FC) in mRNA abundance was calculated between the Nucl and Cyto fractions for both GFP and ORF6 expressing cells, without and with IFN treatment (see S4B Fig). The log2-FC in mRNA abundance was then directly compared between ORF6 and GFP, without (left panel) and with (right panel) IFN, to determine which mRNAs were specifically enriched in the nucleus or cytoplasm by ORF6. The log-2FC was weighted against the adjusted p-value (shrunken Log2-FC) to show significantly enriched mRNAs (yellow points). The number of mRNAs significantly enriched is shown. The mRNA count was normalised and averaged between the three biological repeats. (C) Venn diagram of the number of mRNAs that were significantly enriched in the nucleus by ORF6 with and without IFN. (D) mRNAs significantly enriched by ORF6 without IFN treatment were analysed for enriched GO terms, which were filtered and mapped using the REVIGO tool. Highly similar GO terms are grouped and linked. Colour intensity reflects significance levels.

