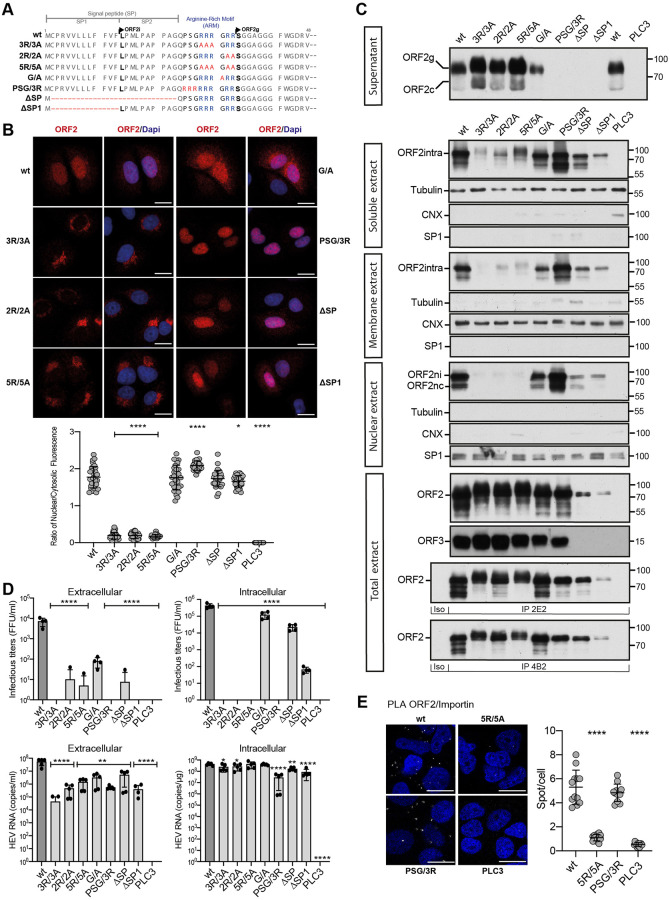
Fig 2. ORF2 contains an Arginine-Rich Motif (ARM) that is important for its nuclear localization.
(A) Schematic sequence alignment of HEV-p6 ORF2wt and ARM/SP mutants. (B) Subcellular localization of HEV-p6 ORF2wt and ARM/SP mutants. PLC3 cells were electroporated with wt and mutant HEV-p6 RNAs. At 18 h.p.e, cells were processed for indirect immunofluorescence using the 1E6 anti-ORF2 antibody (Ab) and analyzed by confocal microscopy (magnification x63). Red = ORF2; Blue = DAPI. Scale bar, 20μm. Nuclear/cytosolic fluorescence intensity quantification was done using ImageJ software (mean ± S.D., n ≥ 30 cells, Kruskal-Wallis with Conover’s test). *p < 0.05, ****p < 0.0001. (C) Subcellular fractionation of PLC3/HEV-p6 expressing ORF2wt and ARM/SP mutants at 10 d.p.e. Fractionation was done using a subcellular protein fractionation kit for cultured cells. ORF2 proteins were detected by WB with 1E6 Ab. Glycosylated ORF2 (ORF2g), cleaved ORF2 (ORF2c), intracellular ORF2 (ORF2intra), nuclear ORF2intra (ORF2ni), nuclear and cleaved ORF2intra (ORF2nc) are indicated. ORF3 protein in cell lysates was detected with a rabbit anti-ORF3 Ab. Tubulin, ER marker Calnexin (CNX) and the transcription factor SP1 used as a nuclear marker, were also detected to check the quality of fractionation. 2E2 and 4B2 are conformation-specific anti-ORF2 antibodies. Molecular mass markers are indicated on the right (kDa). (D) Infectious titer determination and HEV RNA quantification in PLC3/HEV-p6 expressing ORF2wt or mutant proteins. Extra- and intracellular viral particles were extracted at 10 d.p.e and used to infect naïve Huh-7.5 cells for 3 days. Cells were next processed for indirect immunofluorescence. ORF2-positive cells were counted and each positive cell focus was considered as one FFU. Results were expressed in FFU/ml (n = 4). Extra- and intracellular viral RNAs were quantified at 10 d.p.e by RT-qPCR (n ≥ 5) (mean ± S.D., Kruskal-Wallis with Conover’s test). *p < 0.05, **p < 0.01, ****p < 0.0001. (E) PLC3/HEV-p6-wt, PLC3/HEV-p6-5R/5A, PLC3/HEV-p6-PSG/3R and PLC3 mock cells were processed for proximity ligation assay using antibodies to ORF2 and Importin-α1 at 18 h.p.e. Stacks of images corresponding to the total volume of the cells were acquired, and maximum intensity projections of the stacks were generated. For each condition, 12 fields of cells were analyzed (total cell number ≥ 165). Scaled regions of interest of a representative field (left) and quantification of spot/cell (right) are shown (mean ± S.D., Kruskal-Wallis with Conover’s test). ****p < 0.0001.

