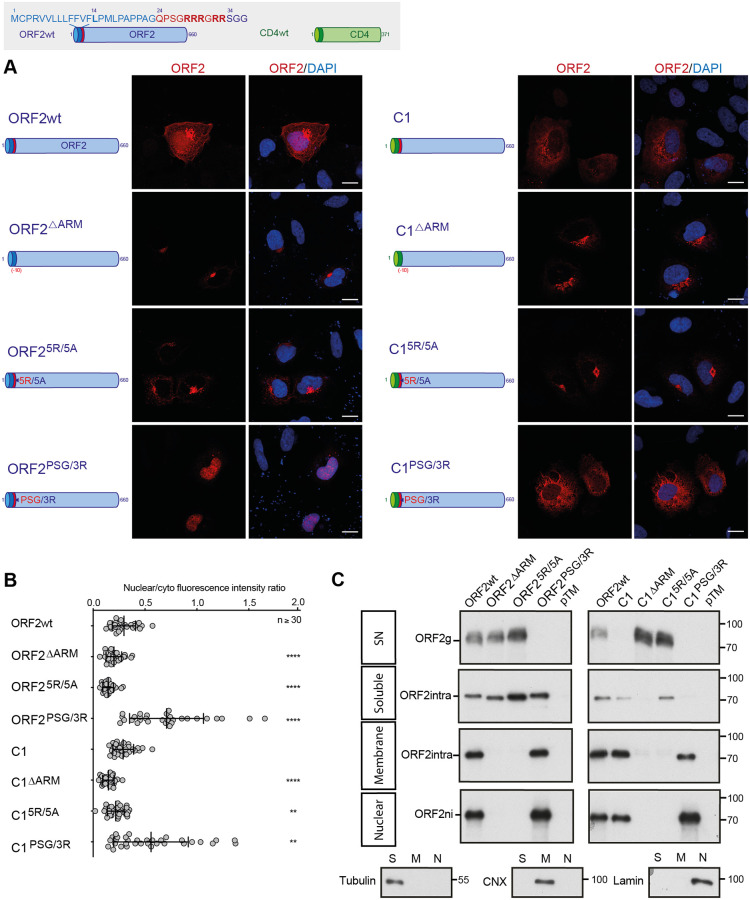
Fig 5. The ORF2 ARM is the regulator of ORF2 addressing.
Schematic representation of ORF2wt and CD4wt proteins. ORF2 sequences are in blue. ARM residues are highlighted in red. CD4 sequences are in green. (A) H7-T7-IZ cells were transfected with pTM plasmids expressing wt, mutant or chimeric ORF2 proteins. Twenty-four hours post-transfection, cells were fixed and processed for ORF2 staining (in red). Nuclei are in blue. Representative confocal images are shown together with ORF2/DAPI merge images (magnification x63). Blue dots observed in some pictures are DAPI-stained transfected plasmids. A schematic representation of each construct is shown on the left. Scale bar, 20μm. (B) Nuclear-to-cytoplasmic ORF2 staining ratio in H7-T7-IZ cells expressing mutant and chimeric ORF2 proteins. Quantification was done using ImageJ software (mean ± S.D., n ≥ 30 cells, Kruskal-Wallis with Conover’s test). **p < 0.01, ****p < 0.0001. (C) Subcellular fractionation of H7-T7-IZ cells expressing mutant and chimeric ORF2 proteins at 24h post-transfection. Fractionation was done using a subcellular protein fractionation kit for cultured cells. ORF2 proteins were detected by WB with 1E6 Ab. Tubulin, Calnexin (CNX) and Lamin B1 were also detected to control the quality of fractionation. Molecular mass markers are indicated on the right (kDa).

