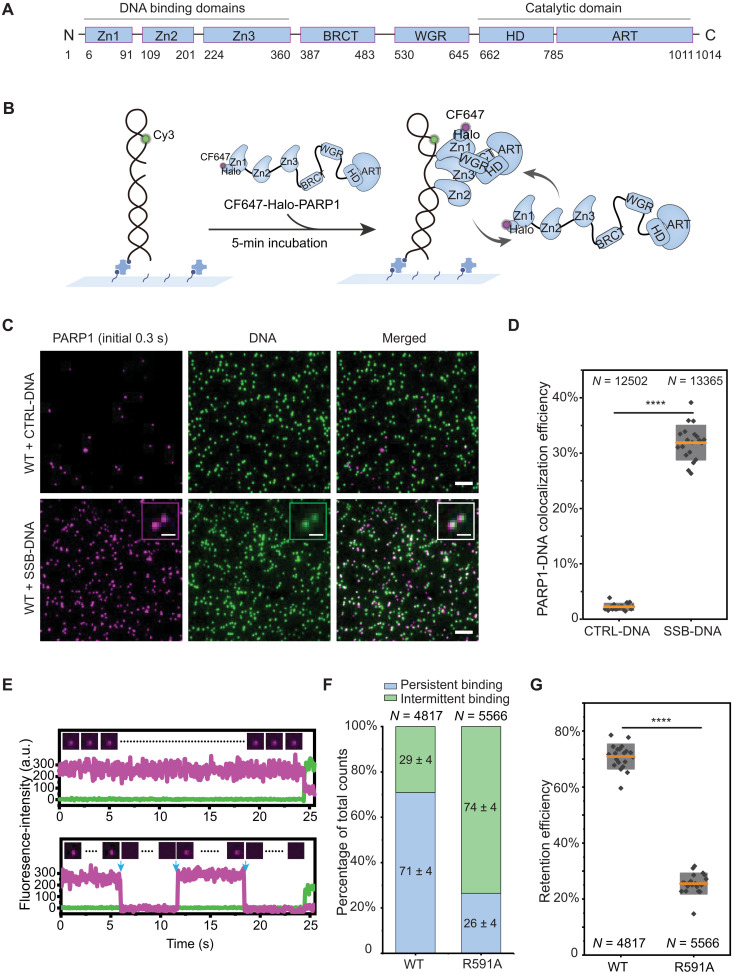
Fig. 1. Single-molecule kinetics of PARP1 retention on DNA lesions.
(A) PARP1 protein domains. (B) Schematic of smCL assays. Biotinylated DNA substrates labeled with Cy3 (shown in green) were immobilized onto the surface of a microfluidic chamber via biotin-neutravidin linkages. PARP1 (HaloTag-PARP1, 2 nM) labeled with CF647 shown in magenta was injected into the chamber, and data were acquired following a 5-min incubation. (C) Representative images of DNA or PARP1 molecules, showing nearly no PARP1 colocalization with CTRL-DNA (top) and PARP1 colocalization with SSB-DNA (bottom). Insets show magnified images of PARP1:DNA colocalization. Scale bars, 5 μm (original images) and 1 μm (insets). (D) Quantification of colocalization efficiency of PARP1 with CTRL-DNA or SSB-DNA. N is the total number of DNA molecules measured. Orange lines and gray boxes indicate means ± SD. Individual data points represent colocalization efficiency analyzed using data from a single imaging area. (E) Representative single-molecule trajectories of PARP1:SSB-DNA colocalization as a function of time, showing persistent binding (top) and intermittent binding (bottom) of PARP1 to SSB-DNA. Insets show representative frames of PARP1 from the trajectories, and blue arrows denote dissociation and binding events. a.u., arbitrary unit. (F) Quantification of the percentage of persistent (blue) or intermittent (green) binding events of WT-PARP1 or R591A on SSB-DNA. N is the total number of PARP1:DNA trajectories, and the mean ± SD of each population is shown on the column. (G) Quantification of retention efficiency of PARP1 or R591A on SSB-DNA. N is the total number of PARP1:DNA trajectories. The P value of two-sample t test is as indicated. ****P ≤ 0.0001.

