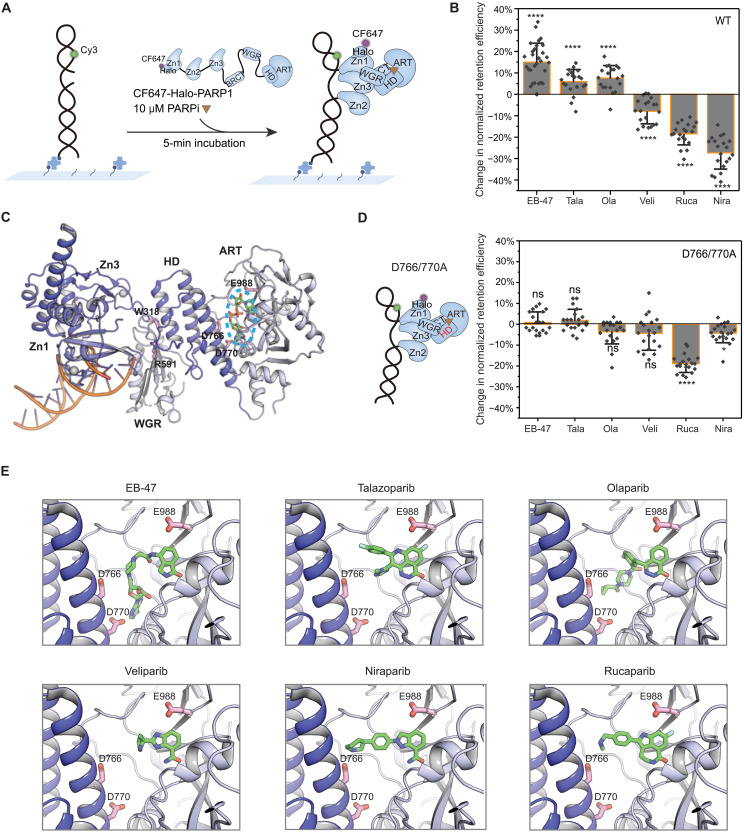
Fig. 2. Distinct modes of allosteric modulation induced by different PARPi.
(A) Schematic of smCL assays of PARP1:DNA measured in the presence of PARPi. (B) Quantification of change in retention efficiency of WT-PARP1 in the presence of different PARPi. Data for 10 μM EB-47 (N = 5072), Tala (talazoparib; N = 6161), Ola (olaparib; N = 4657), Veli (veliparib; N = 5303), Rucap (rucaparib; N = 4542), or Nira (niraparib; N = 5565) was plotted relative to PARP1 only control (DMSO). (C) A model of crystal structure of PARP1 essential domains (Protein Data Bank code 4DQY) binding with nonhydrolyzable NAD+ analog indicated in the blue dashed ellipse at catalytic pocket. All mutated amino acids [W318 in Zn3, R591 in WGR, D766/770 in HD, and E988 in ADP-ribosyl-transferase (ART) domain] in this study are shown in the model. (D) Left: Schematic of HD domain (highlighted in red) mutant D766/770A. Right: Quantification of change in retention efficiency of D766/770A mutant in the presence of 10 μM EB-47 (N = 4882), Tala (N = 4785), Ola (N = 4682), Veli (N = 4985), Rucap (N = 4598), or Nira (N = 4814). (E) Zoomed-in panels of PARPi binding to the catalytic pocket. In (B) and (D), color bars and error bars indicate mean and SD, respectively. N is the total number of PARP1:DNA trajectories. Individual data points represent the measured retention efficiency analyzed using data from one imaging area. The P value of two-sample t test is as indicated. ns, nonsignificant difference; *P ≤ 0.05 and ****P ≤ 0.0001.

