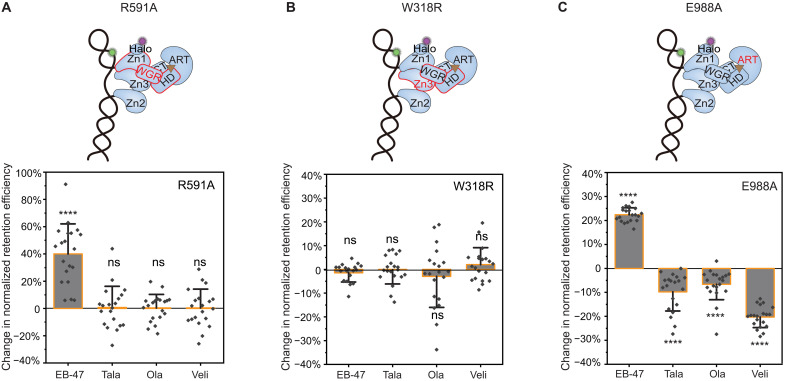
Fig. 3. Mechanisms of allosteric modulation induced by different PARPi.
(A) Top: Schematic of the WGR domain mutation R591A disrupting PARP1 allostery through the Zn1-WGR-HD interface highlighted in red. Bottom: Quantification of change in retention efficiency of R591A mutant in the presence of 10 μM EB-47 (N = 5112), Tala (N = 5817), Ola (N = 5629), and Veli (N = 4067). (B) Top: Schematic of the Zn3 domain mutation W318R disrupting PARP1 allostery through the WGR-Zn3-HD interface highlighted in red. Bottom: Quantification of change in retention efficiency of W318R mutant in the presence of 10 μM EB-47 (N = 4470), Tala (N = 4100), Ola (N = 4198), and Veli (N = 3598). (C) Top: Schematic of the ART domain (highlighted in red) mutant E988A. Bottom: Quantification of change in retention efficiency of E988A mutant in the presence of 10 μM EB-47 (N = 4114), Tala (N = 4971), Ola (N = 4799), or Veli (N = 4822). Color bars and error bars indicate mean and SD, respectively. N is the total number of PARP1:DNA trajectories. Individual data points represent the measured retention efficiency analyzed using data from one imaging area. The P value of two-sample t test is as indicated. ****P ≤ 0.0001.

