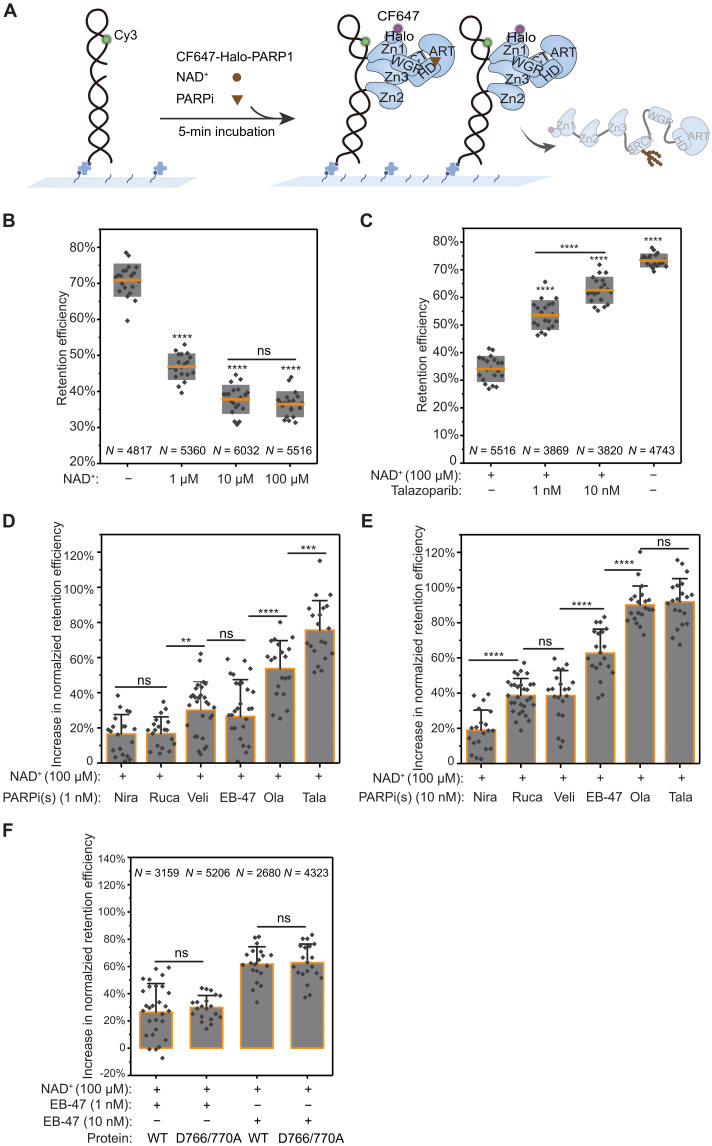
Fig. 4. PARP1 retention on DNA is governed by PARPi binding competition with NAD+.
(A) Schematic of smCL assays of PARP1:DNA measured in the presence of NAD+ and PARPi. (B) Quantification of PARP1 retention efficiency in the absence or presence of 1, 10, or 100 μM NAD+. Orange lines and gray boxes indicate means ± SD. (C) Quantification of PARP1 retention efficiency in the presence of 100 μM NAD+ alone, in the presence of 1 or 10 nM talazoparib together with 100 μM NAD+, and in the absence of both NAD+ and talazoparib. (D) Quantification of the increase in PARP1 retention efficiency induced by the different PARPi (1 nM) added together with 100 μM NAD+ compared to 100 μM NAD+ alone. Nira (N = 5110), Rucap (N = 4809), Veli (N = 3323), EB-47 (N = 3159), Ola (N = 3553), and Tala (N = 3869). Colored bars and error bars indicate means and SD, respectively. Data were plotted as an increase from 100 μM NAD+ control. (E) Quantification of the increase in PARP1 retention efficiency shows changes in retention at higher PARPi concentration (10 nM) added together with 100 μM NAD+ compared to 100 μM NAD+ alone. Nira (N = 5320), Rucap (N = 5427), Veli (N = 3209), EB-47 (N = 2680), Ola (N = 3604), and Tala (N = 3820). (F) Quantitative comparison of the increase in retention efficiency of WT-PARP1 and D766/770A induced by 1 nM or 10 nM EB-47 added together with 100 μM NAD+. N is the total number of PARP1:DNA trajectories. Individual data points represent the measured retention efficiency analyzed using data from one imaging area. The P value of two-sample t test is as indicated. **P ≤ 0.01, ***P ≤ 0.001, and ****P ≤ 0.0001.

