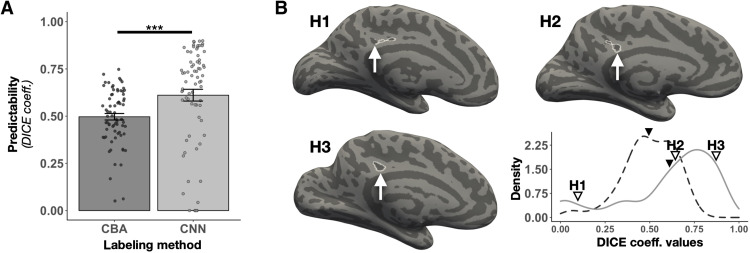
Fig. 8. Automatically defining the ifrms using deep learning algorithms.
(A) Overlap (Dice coefficient) between predicted and manual location of the ifrms for cortex-based alignment (CBA) and spherical convolutional neural network (CNN) methods. Bars represent average values, and the error bars indicate ±1 SEM. Circles represent each individual. Asterisks indicate statistically significant differences between the two approaches (***p < 0.001). (B) Lower right: The density distribution of the ifrms Dice coefficient values for the CBA and CNN approaches. The dashed and solid lines represent the CBA and CNN distributions, respectively. The line for each method is colored the same as in (A). The mean Dice coefficient value is visualized with the solid black triangle for each method (CBA = 0.5, CNN = 0.61). In addition, the Dice coefficient values of three individual participants with the CNN approach (indicated by H1, H2, and H3) are identified with outlined triangles (left to right): low accuracy (H1; Dice = 0.09), mean accuracy (H2; Dice = 0.64), and high accuracy (H3; Dice = 0.87). The three participants’ corresponding LHs (indicated by H1, H2, and H3) are provided to visually illustrate the differing degrees of overlap between the automated CNN labels and the manual labels. The automated ifrms labels are outlined in white, while the manual ifrms labels are identified with a white arrow. These data show that the ifrms is more accurately defined using the novel CNN approach, and importantly, in most hemispheres, the automated labels coincided strongly with the manual labels.

