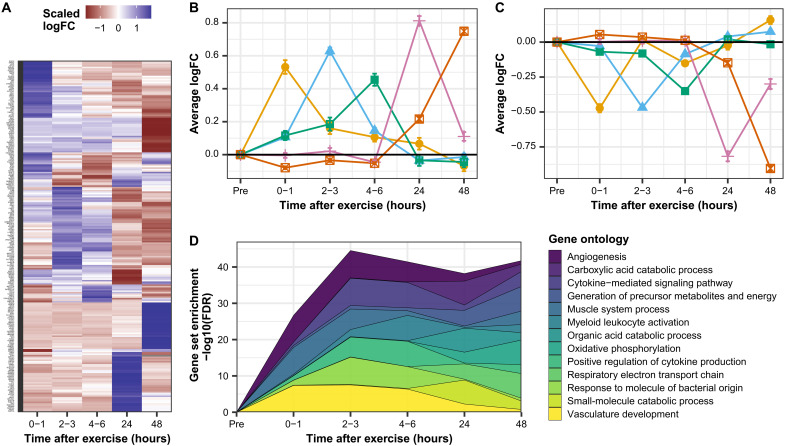
Fig. 1. Exercise triggers waves of transcription associated with inflammation and metabolic processes.
(A) Gene expression changes in skeletal muscle after exercise were collected from the MetaMEx database and processed as described in Materials and Methods. Heatmap of the logFC of genes regulated at each time point. The top 100 genes ranked on FDR are presented. (B and C) Peak time for each significant gene was calculated and the log(fold change) of genes with the same peak time averaged. Orange, average of genes peaking 0 to 1 hour after exercise; blue, average of genes peaking 2 to 3 hours after exercise; green, average of genes peaking 4 to 6 hours after exercise; pink, average of genes peaking 24 hours after exercise; and red, average of genes peaking 48 hours after exercise. (D) Gene set enrichment analysis was performed on logFC-ranked genes at each time point. The top 3 gene ontology terms based on FDR for each time point are presented.

